.avif)
.avif)
You have finally dropped all your data in Retable’s advanced spreadsheet. But you need to prioritize those data to manage them. How do you do that with such a volume of data at hand?
This is where a custom view becomes of use to you.
You get to decide how you view your data, based on your priority. Grid, gallery, form, kanban and more. Toggle between various views to draw perspective for your data.
Table of Contents
- What are views
- Change how your view is displayed
- Explore different view types
- Kanban view
- Grid view
- Calendar view
- List view
- Form view
- Card view
- Map view
- Chart view
- How to create a custom view?
- Conclusion
- Frequently Asked Questions
What are views?
Once the data is entered and the spreadsheets are established, you start customizing the way you would like to view your data, and each of these spreadsheet data views can be tailored to your requirement of viewing the data. Each view allows you to analyze your data in different ways. You can use multiple views to match your team’s needs.
Change how your view is displayed
With Retable, changing views is easy. Retable’s advanced options will allow you to visualize data based on your priority and make it easy to work with your colleagues. With basic filtering views can be changed to fit your needs.
For instance, you may want to just use a specific set of data out of a whole chunk of data for a specific function. This is manually difficult as mistakes may occur. Here is where you use options like filtering, hiding, sorting, coloring, grouping of your records and fields.
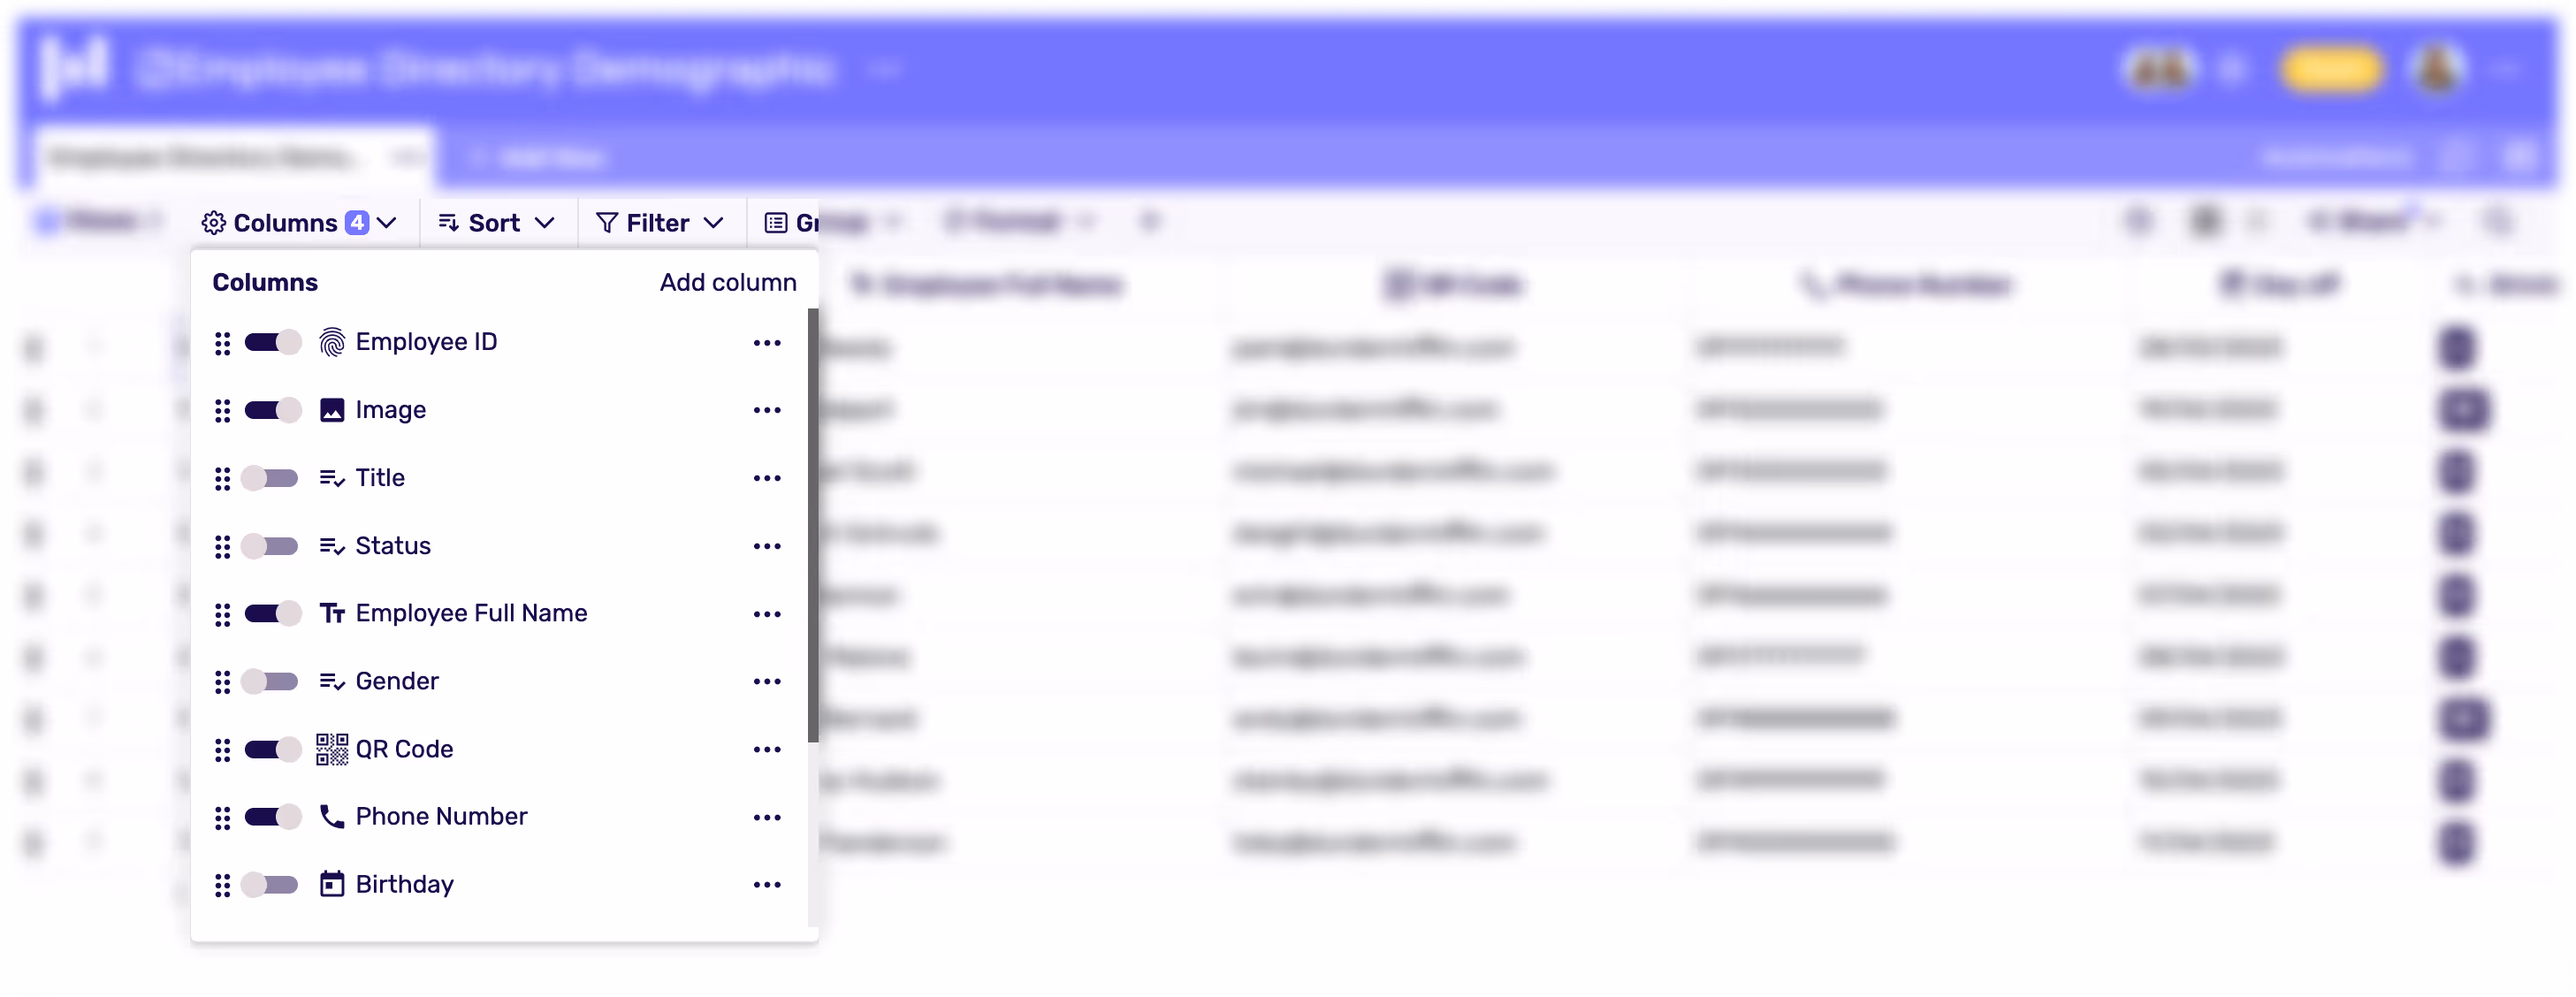
- Hide and Reorder Fields
You may want to surface the most important data at a point of time during your work. This is where you can hide certain data and reorder the rest so that you can focus on the information that is required at that moment.
This will save your time, especially when you want to prioritize a task and when you do not want to lose your valuable time on scrolling through unwanted data for the task.
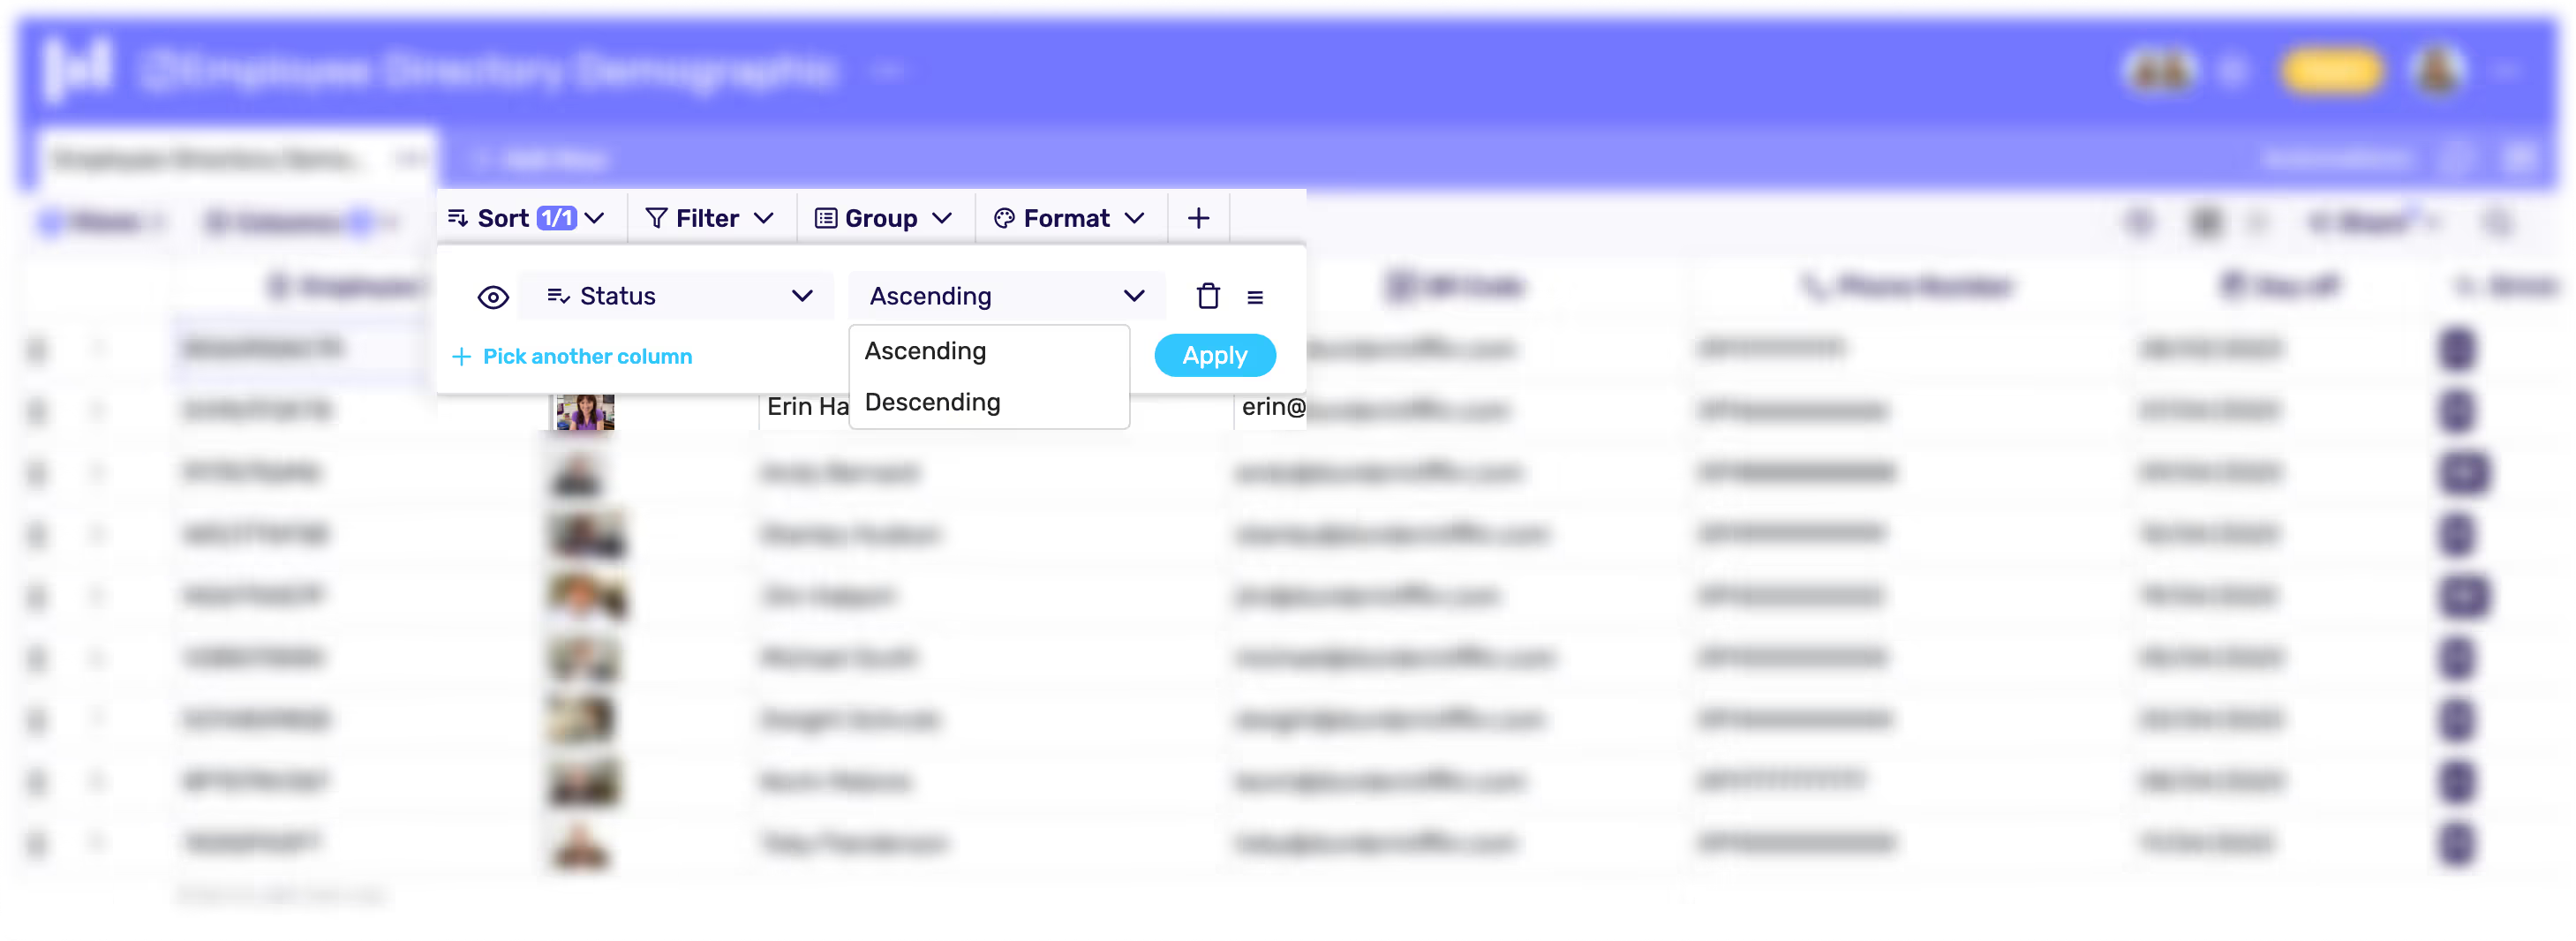
- Sorting Data
You may be familiar with this function. Sorting allows you to choose in which order you would want your information to be displayed.
For instance, you may want to sort your data based on a serial number or sort information based on which employee a particular task was assigned to.
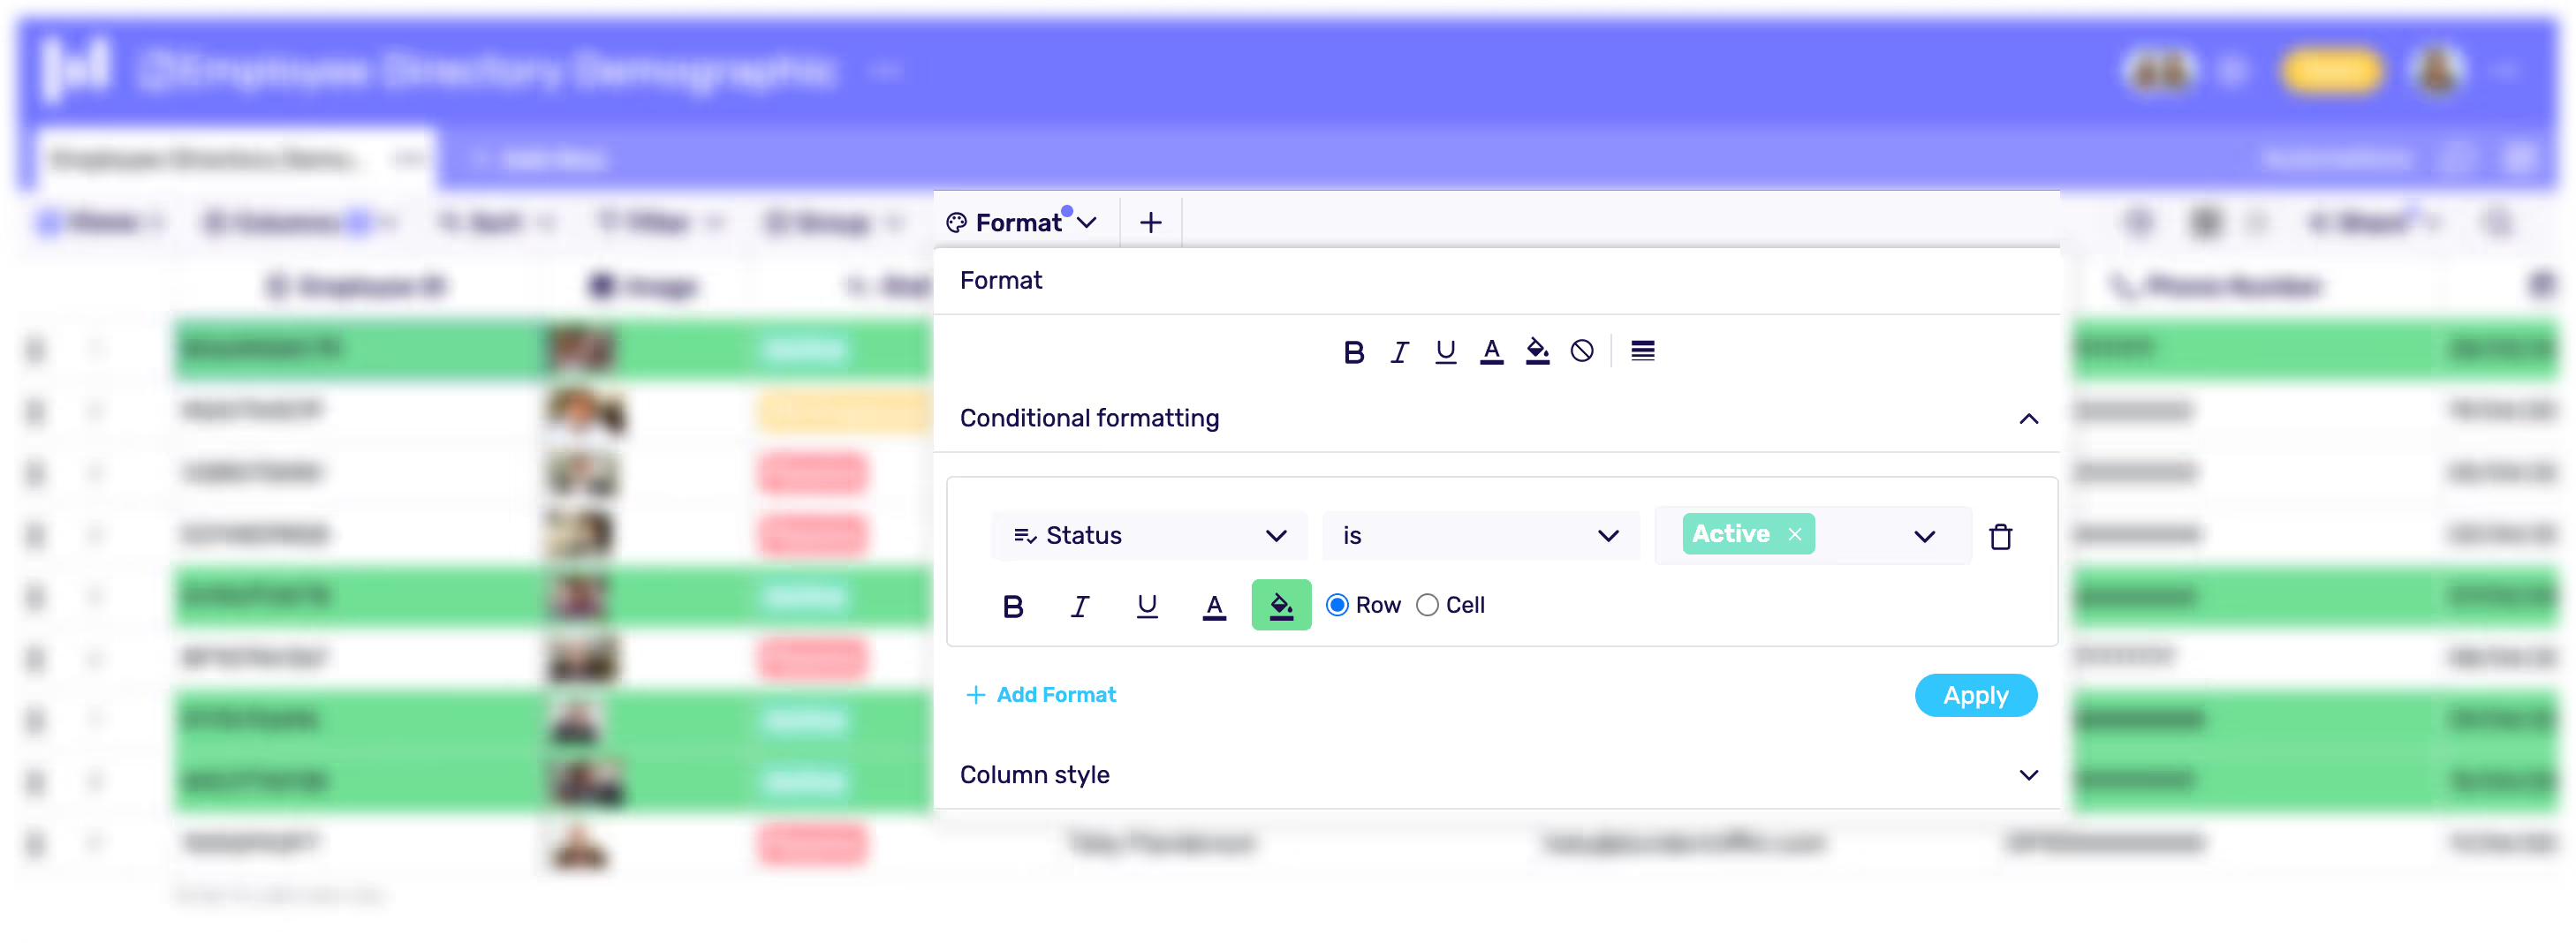
- Colour Records and fields
Coloring fields have multiple reasons. Coloring a particular field can highlight important information. It helps you add extra information to your existing records and fields.
When it comes to complex work, coloring lets the users enhance professionalism, increase user accuracy in using data and interpreting them.
- Filter Out Unwanted Records
Filtering out unwanted information lets one focus on a specific set of data. You can also combine multiple filters to create complex rules for which records are visible.
Unlike sorting data, filtering data allows you to hide unnecessary data.

- Group similar data
Grouping data is another efficient way to parse data. You can group together certain data by the information tracked in various fields.
Tracking status of work, work assignments to colleagues, delivery dates and deadlines can all at once be grouped together so that your work is streamlined.

Explore different view types
Now that we have explored multiple ways to adjust views, lets have a look at
some of the view types.
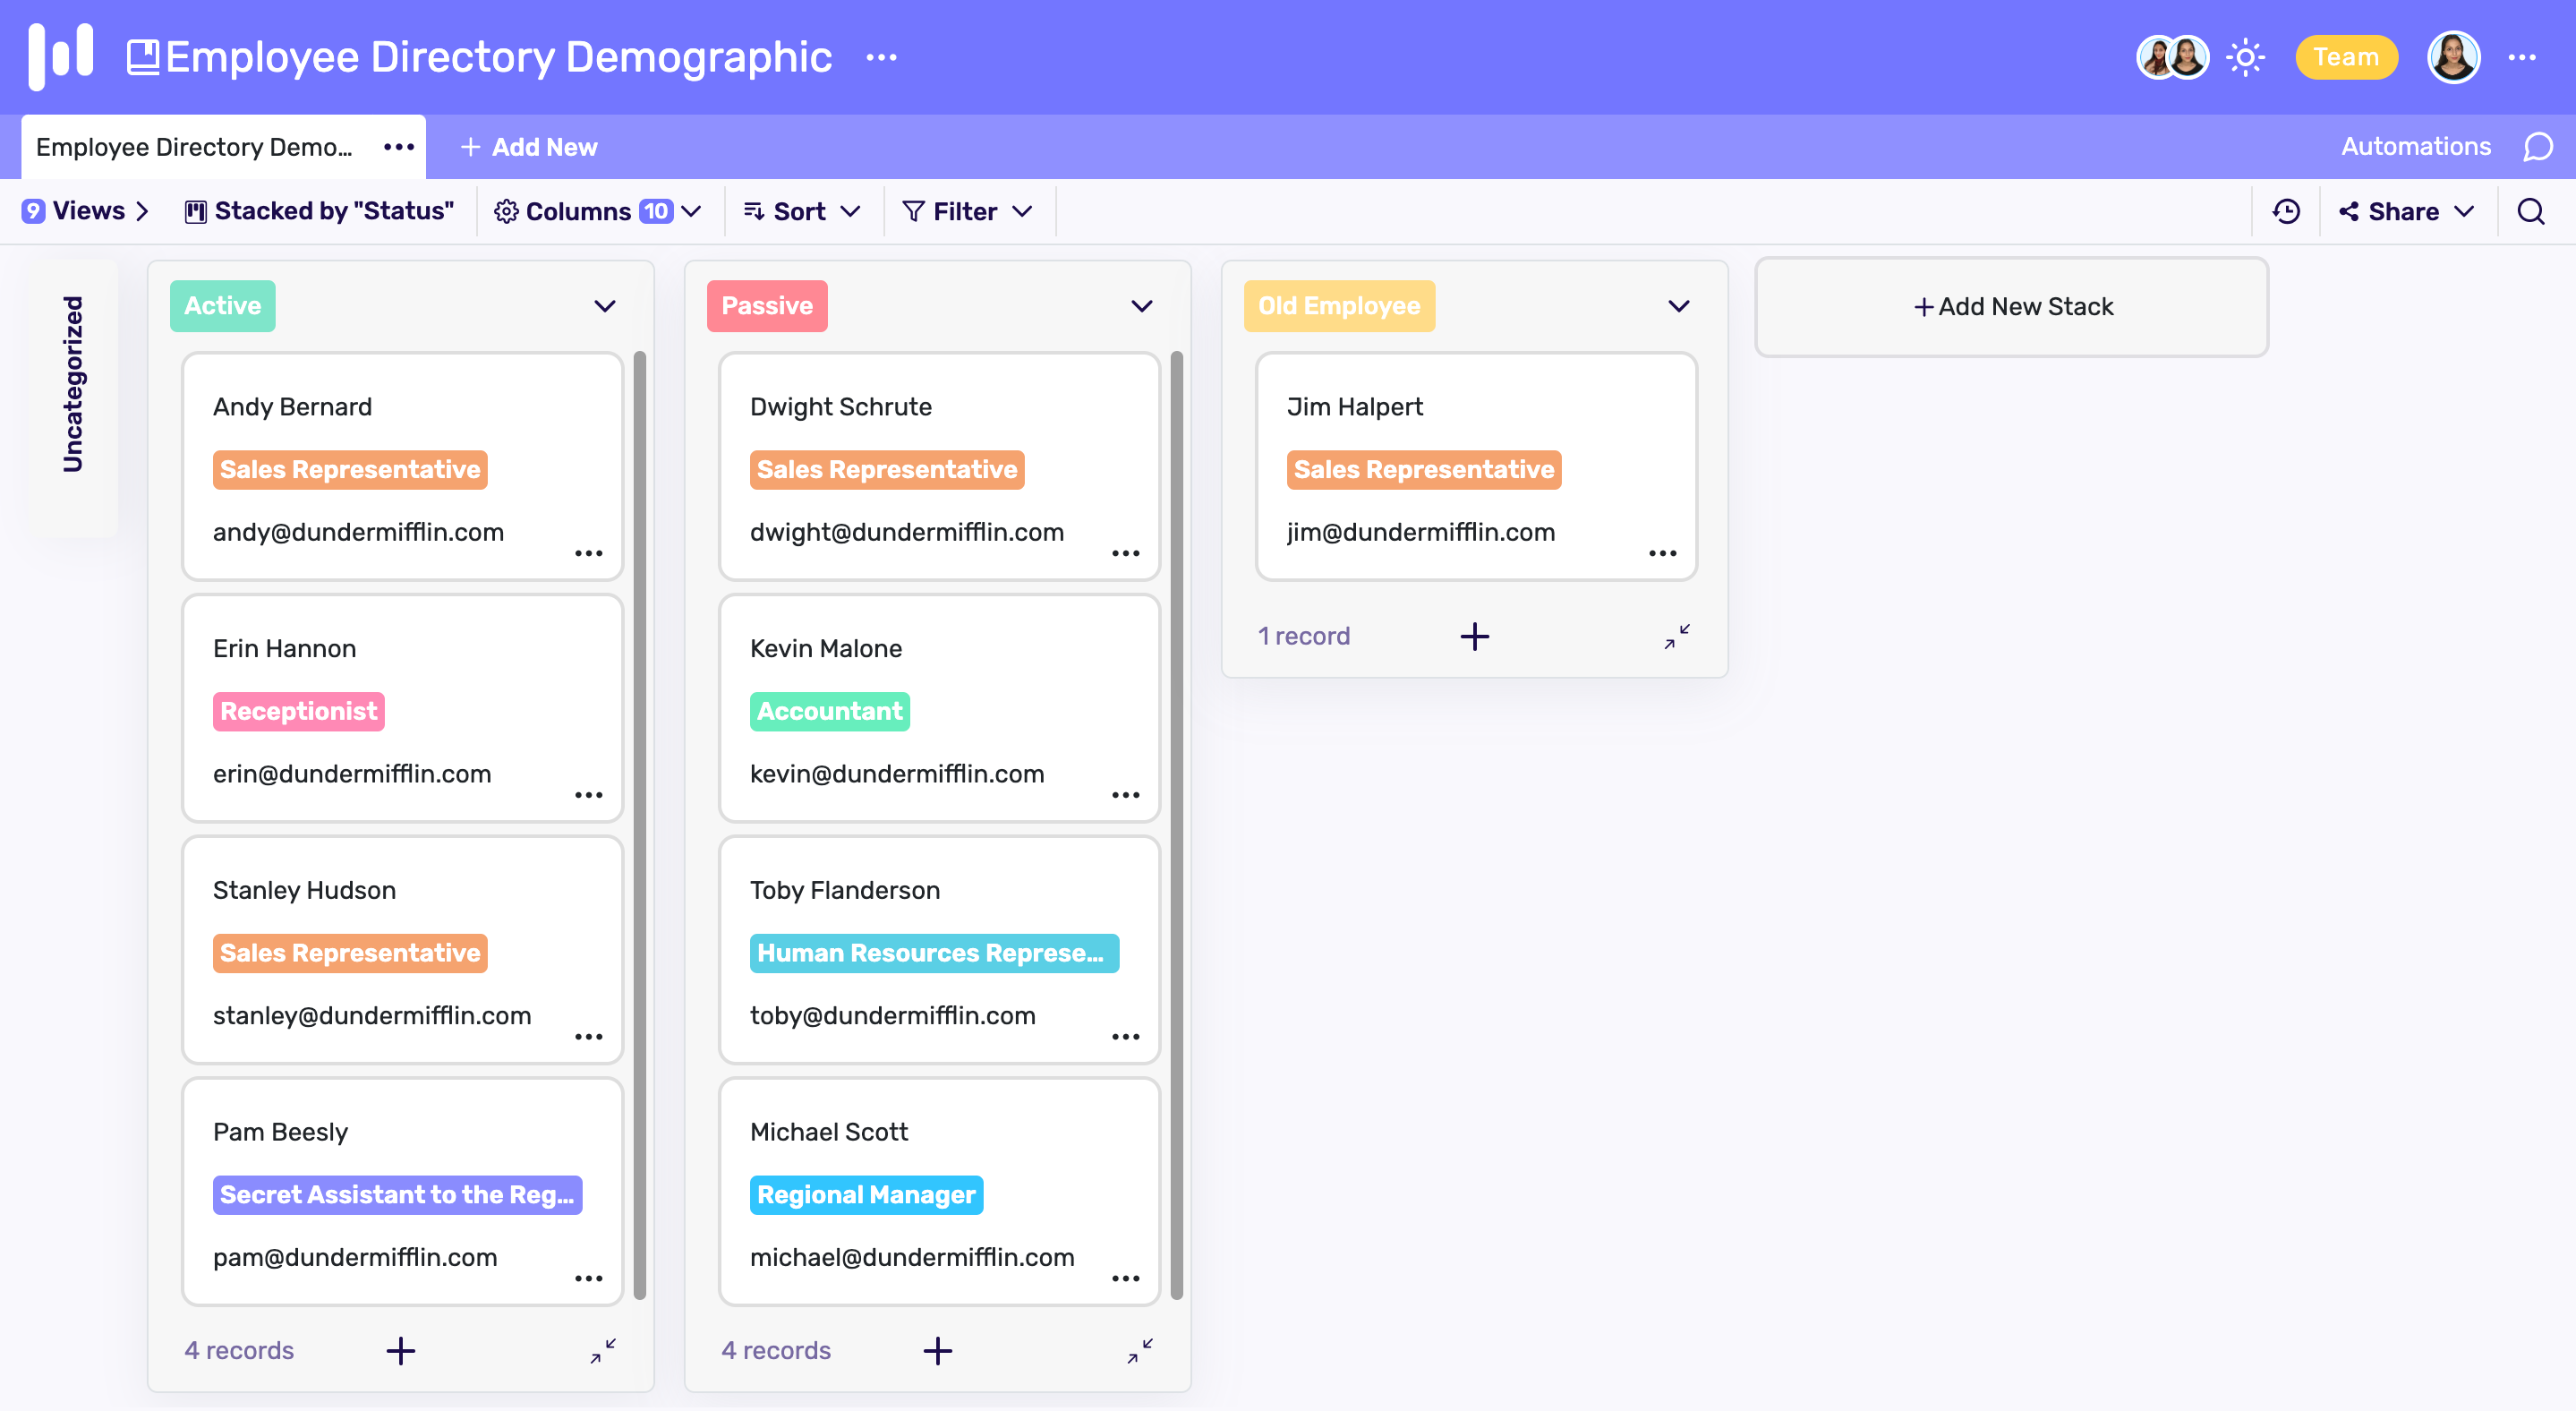
1. Kanban view
Kanban view visually depicts work at various stages and it uses cards to represent work progress or items. Kanban view allows you to drag and drop items making the process all the more easy. This visual representation of multiple projects allows one to analyze the work progress at once.
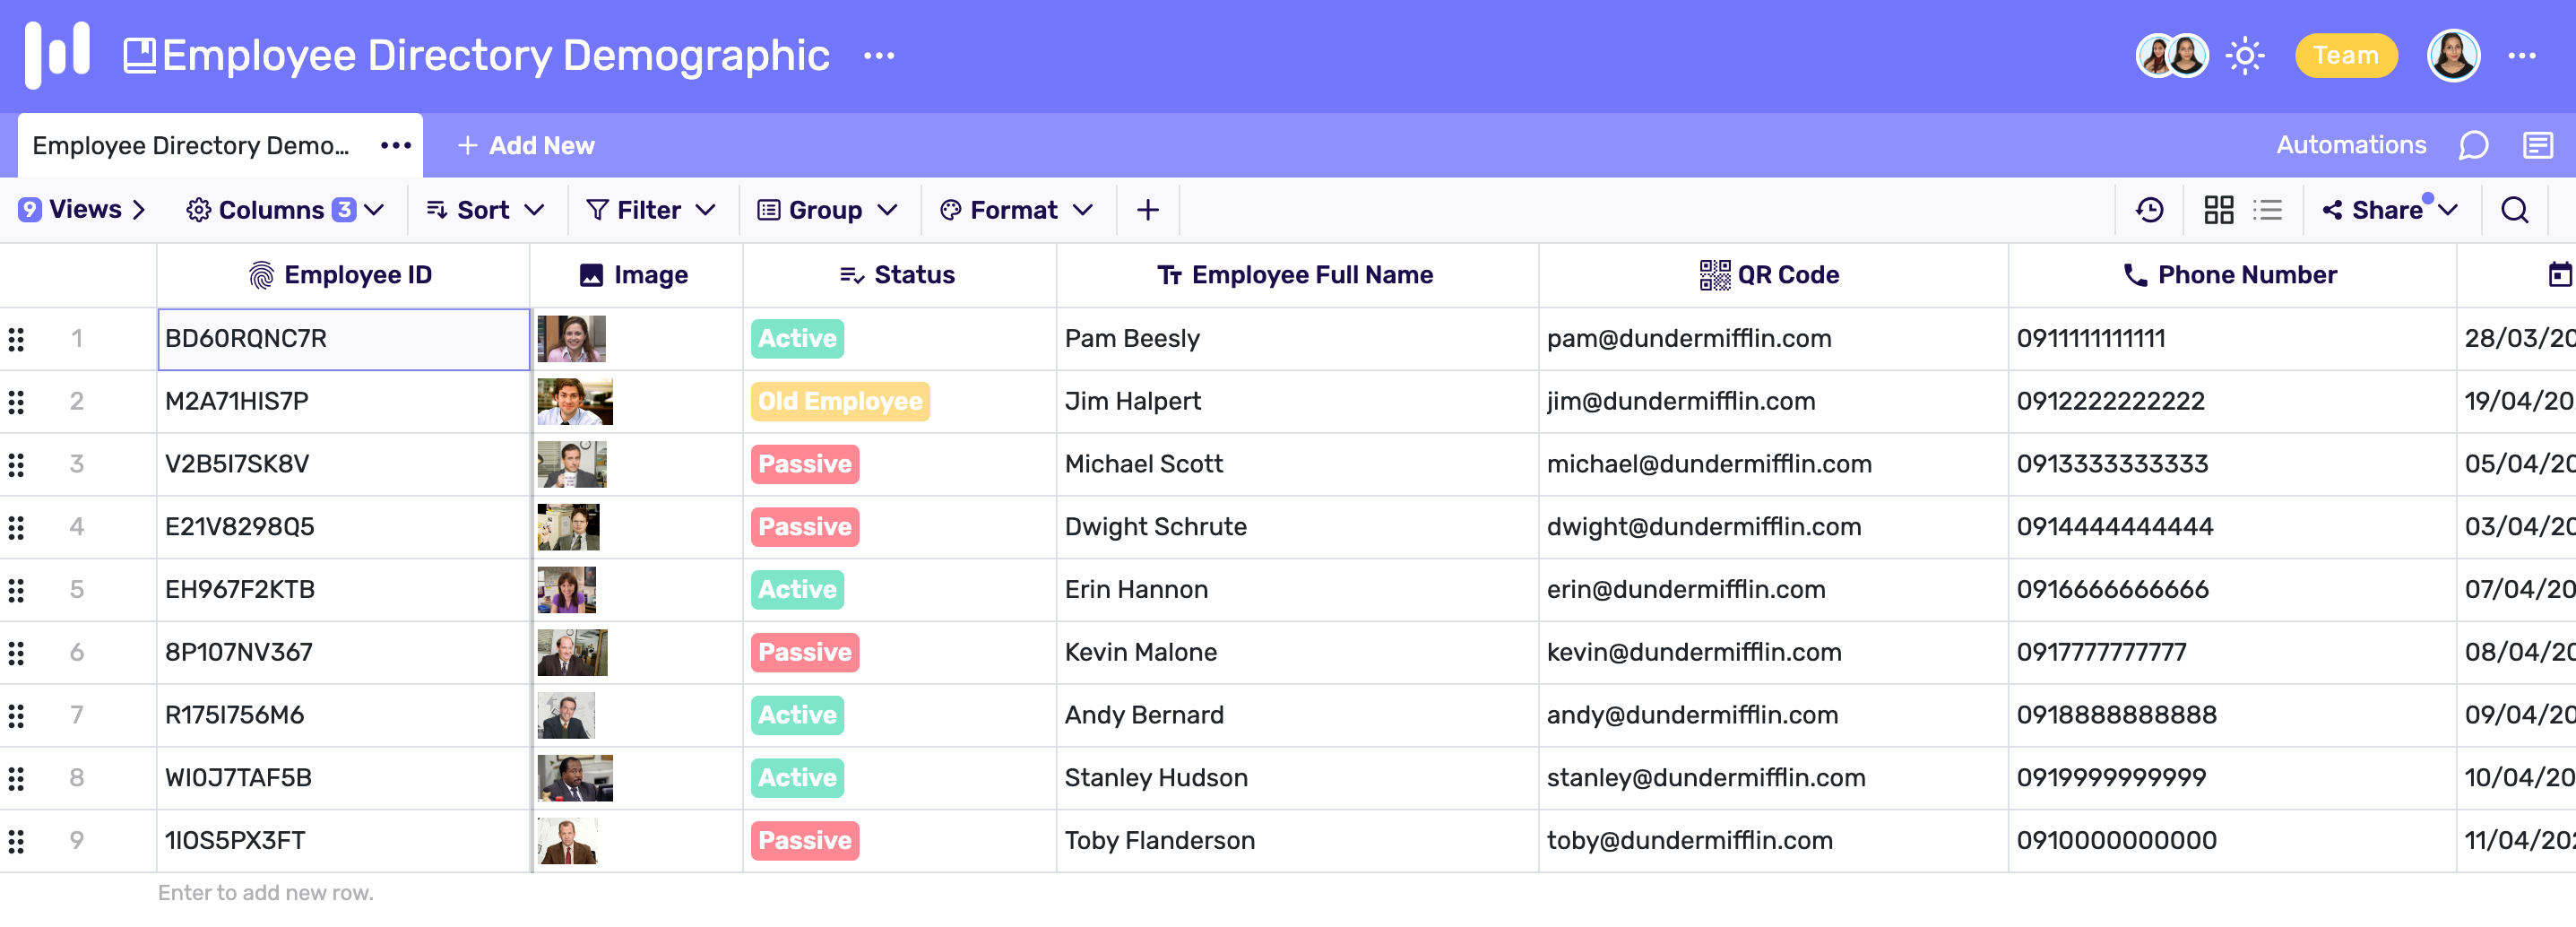
2. Grid view
Grid view represents data as a series of rows and columns. Grid view is the most traditional way of representing a large volume of data. Grid view allows scrolling vertically and horizontally to analyse data.
3. Calendar view
Just like the name goes, calendar view allows users to see all the records on a calendar. From daily calendar view to weekly and monthly, users can navigate through the calendar by month, year or decade.

4. List view
List view is one of the easiest and conventional ways to depict data. It lists out items vertically in a scrollable list.
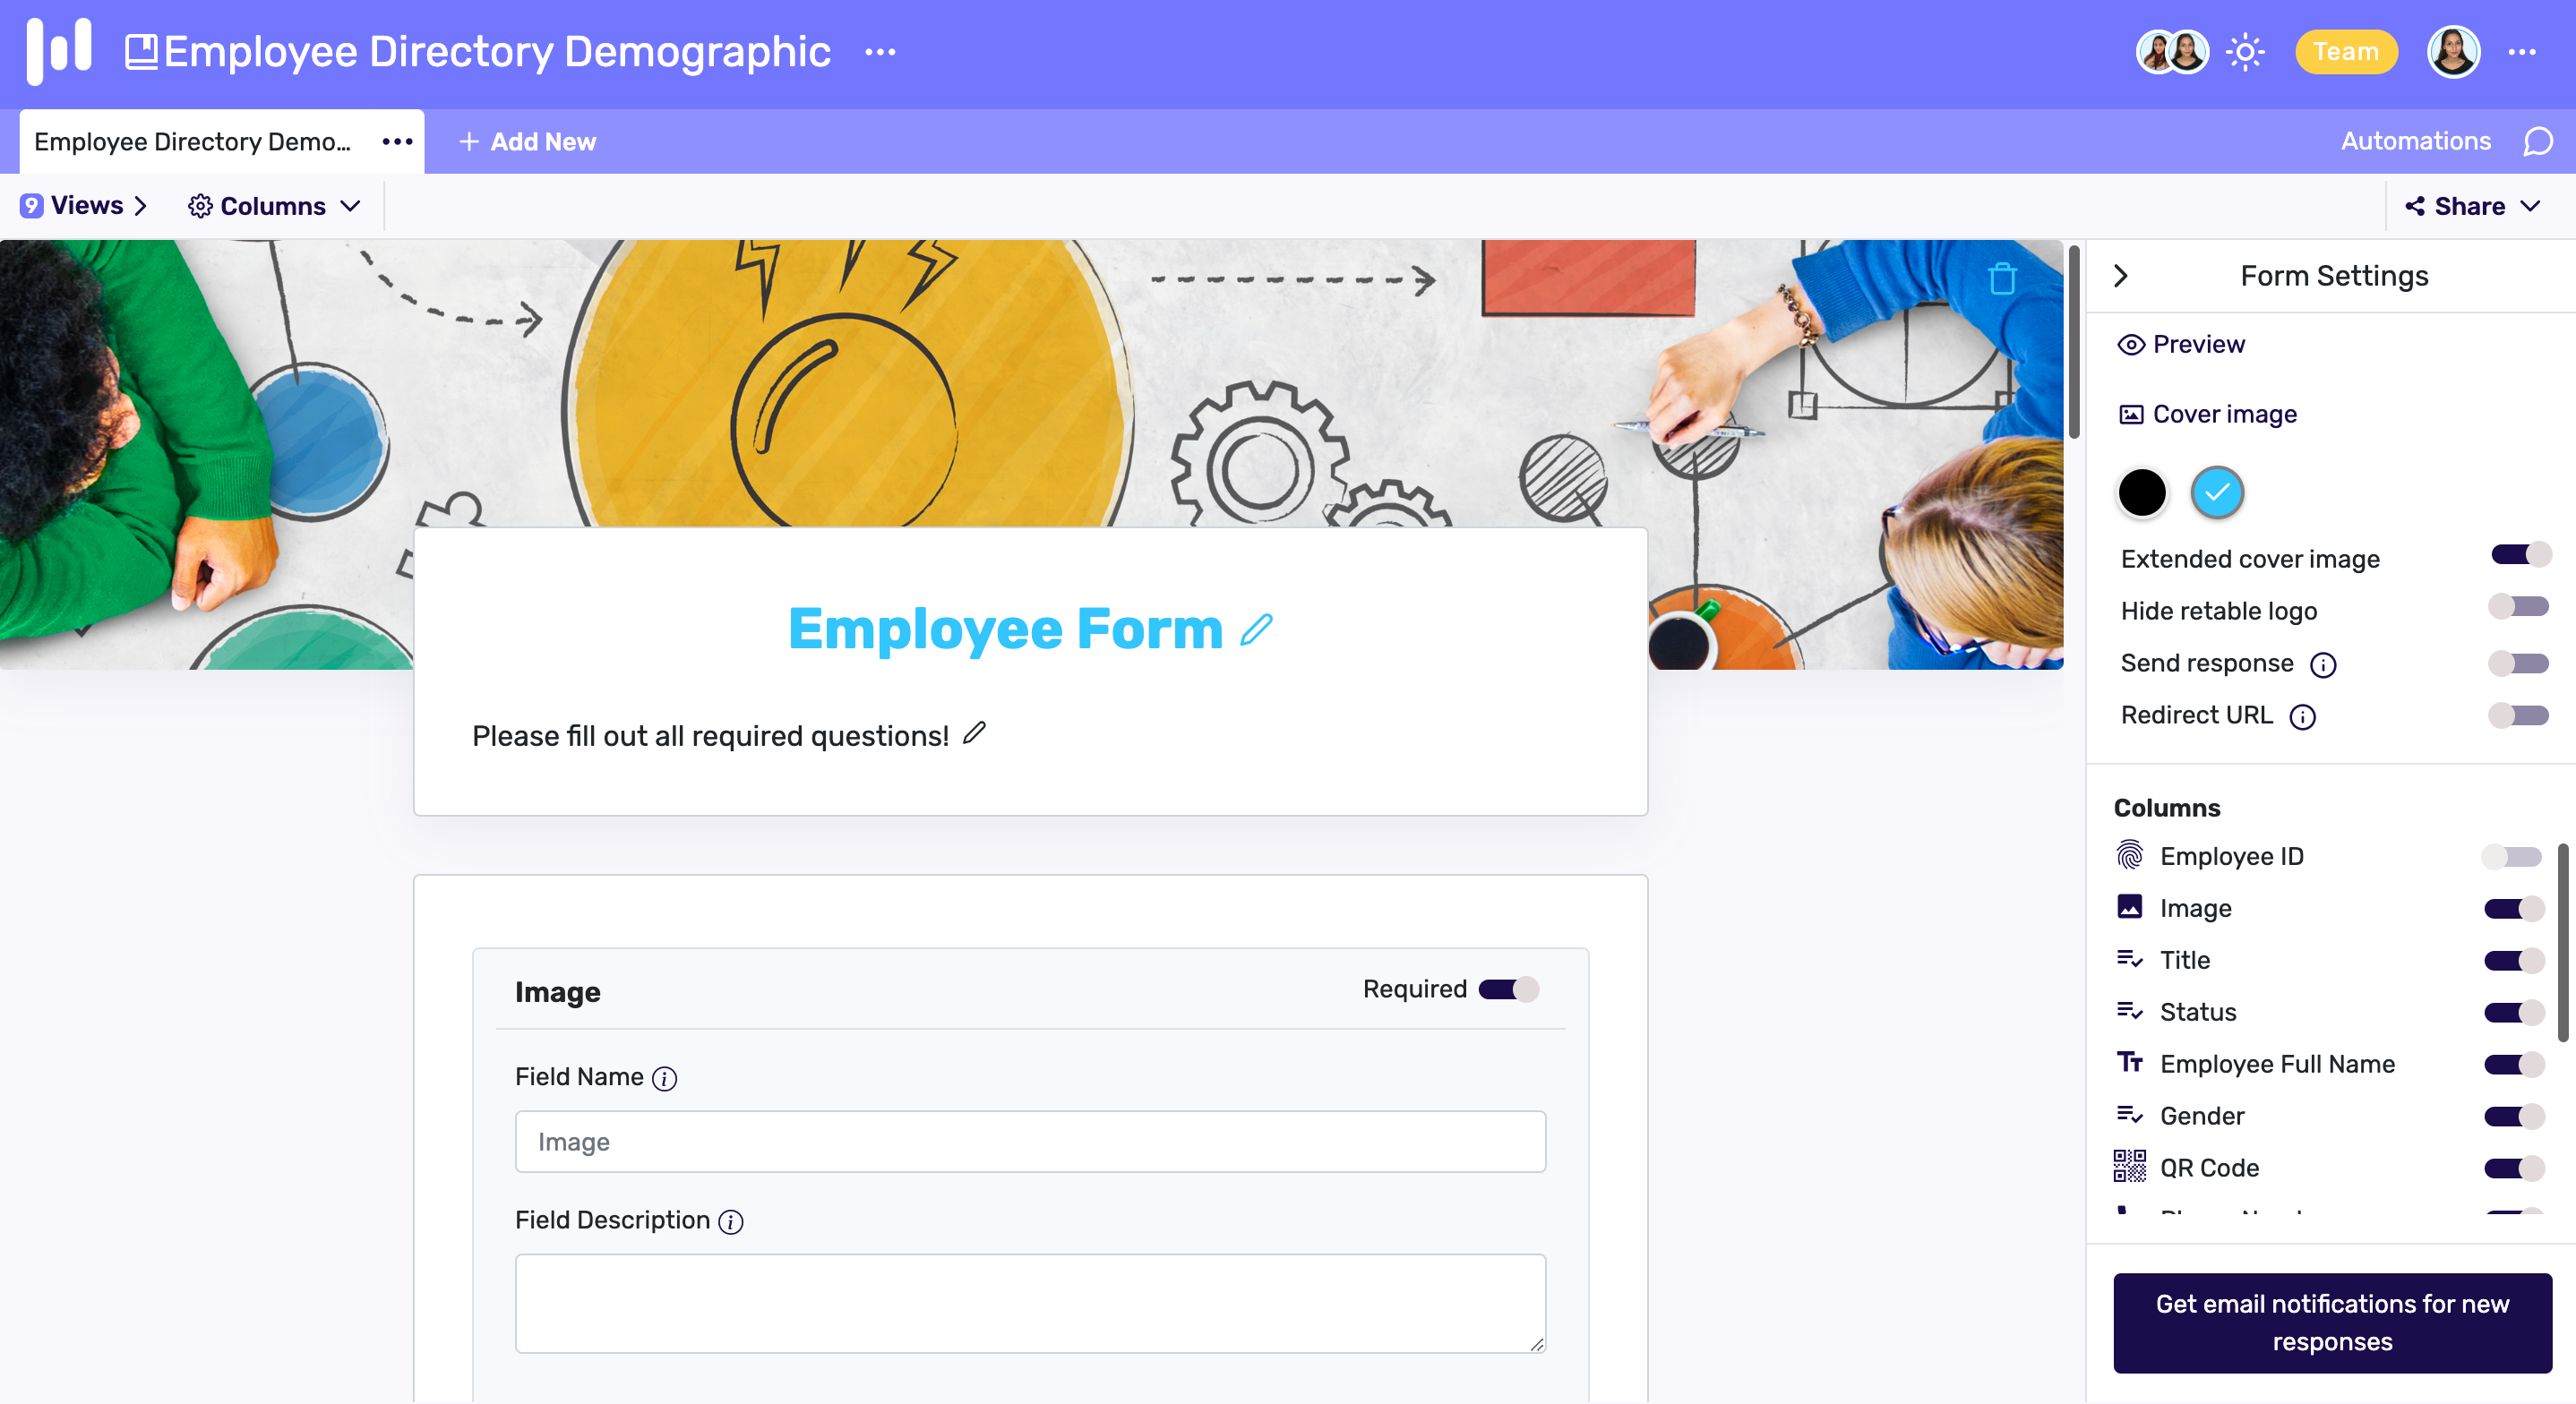
5. Form view
Items in the form view are arranged exactly like a form. These forms are shareable and embeddable. Each row in the view is depicted as a form.
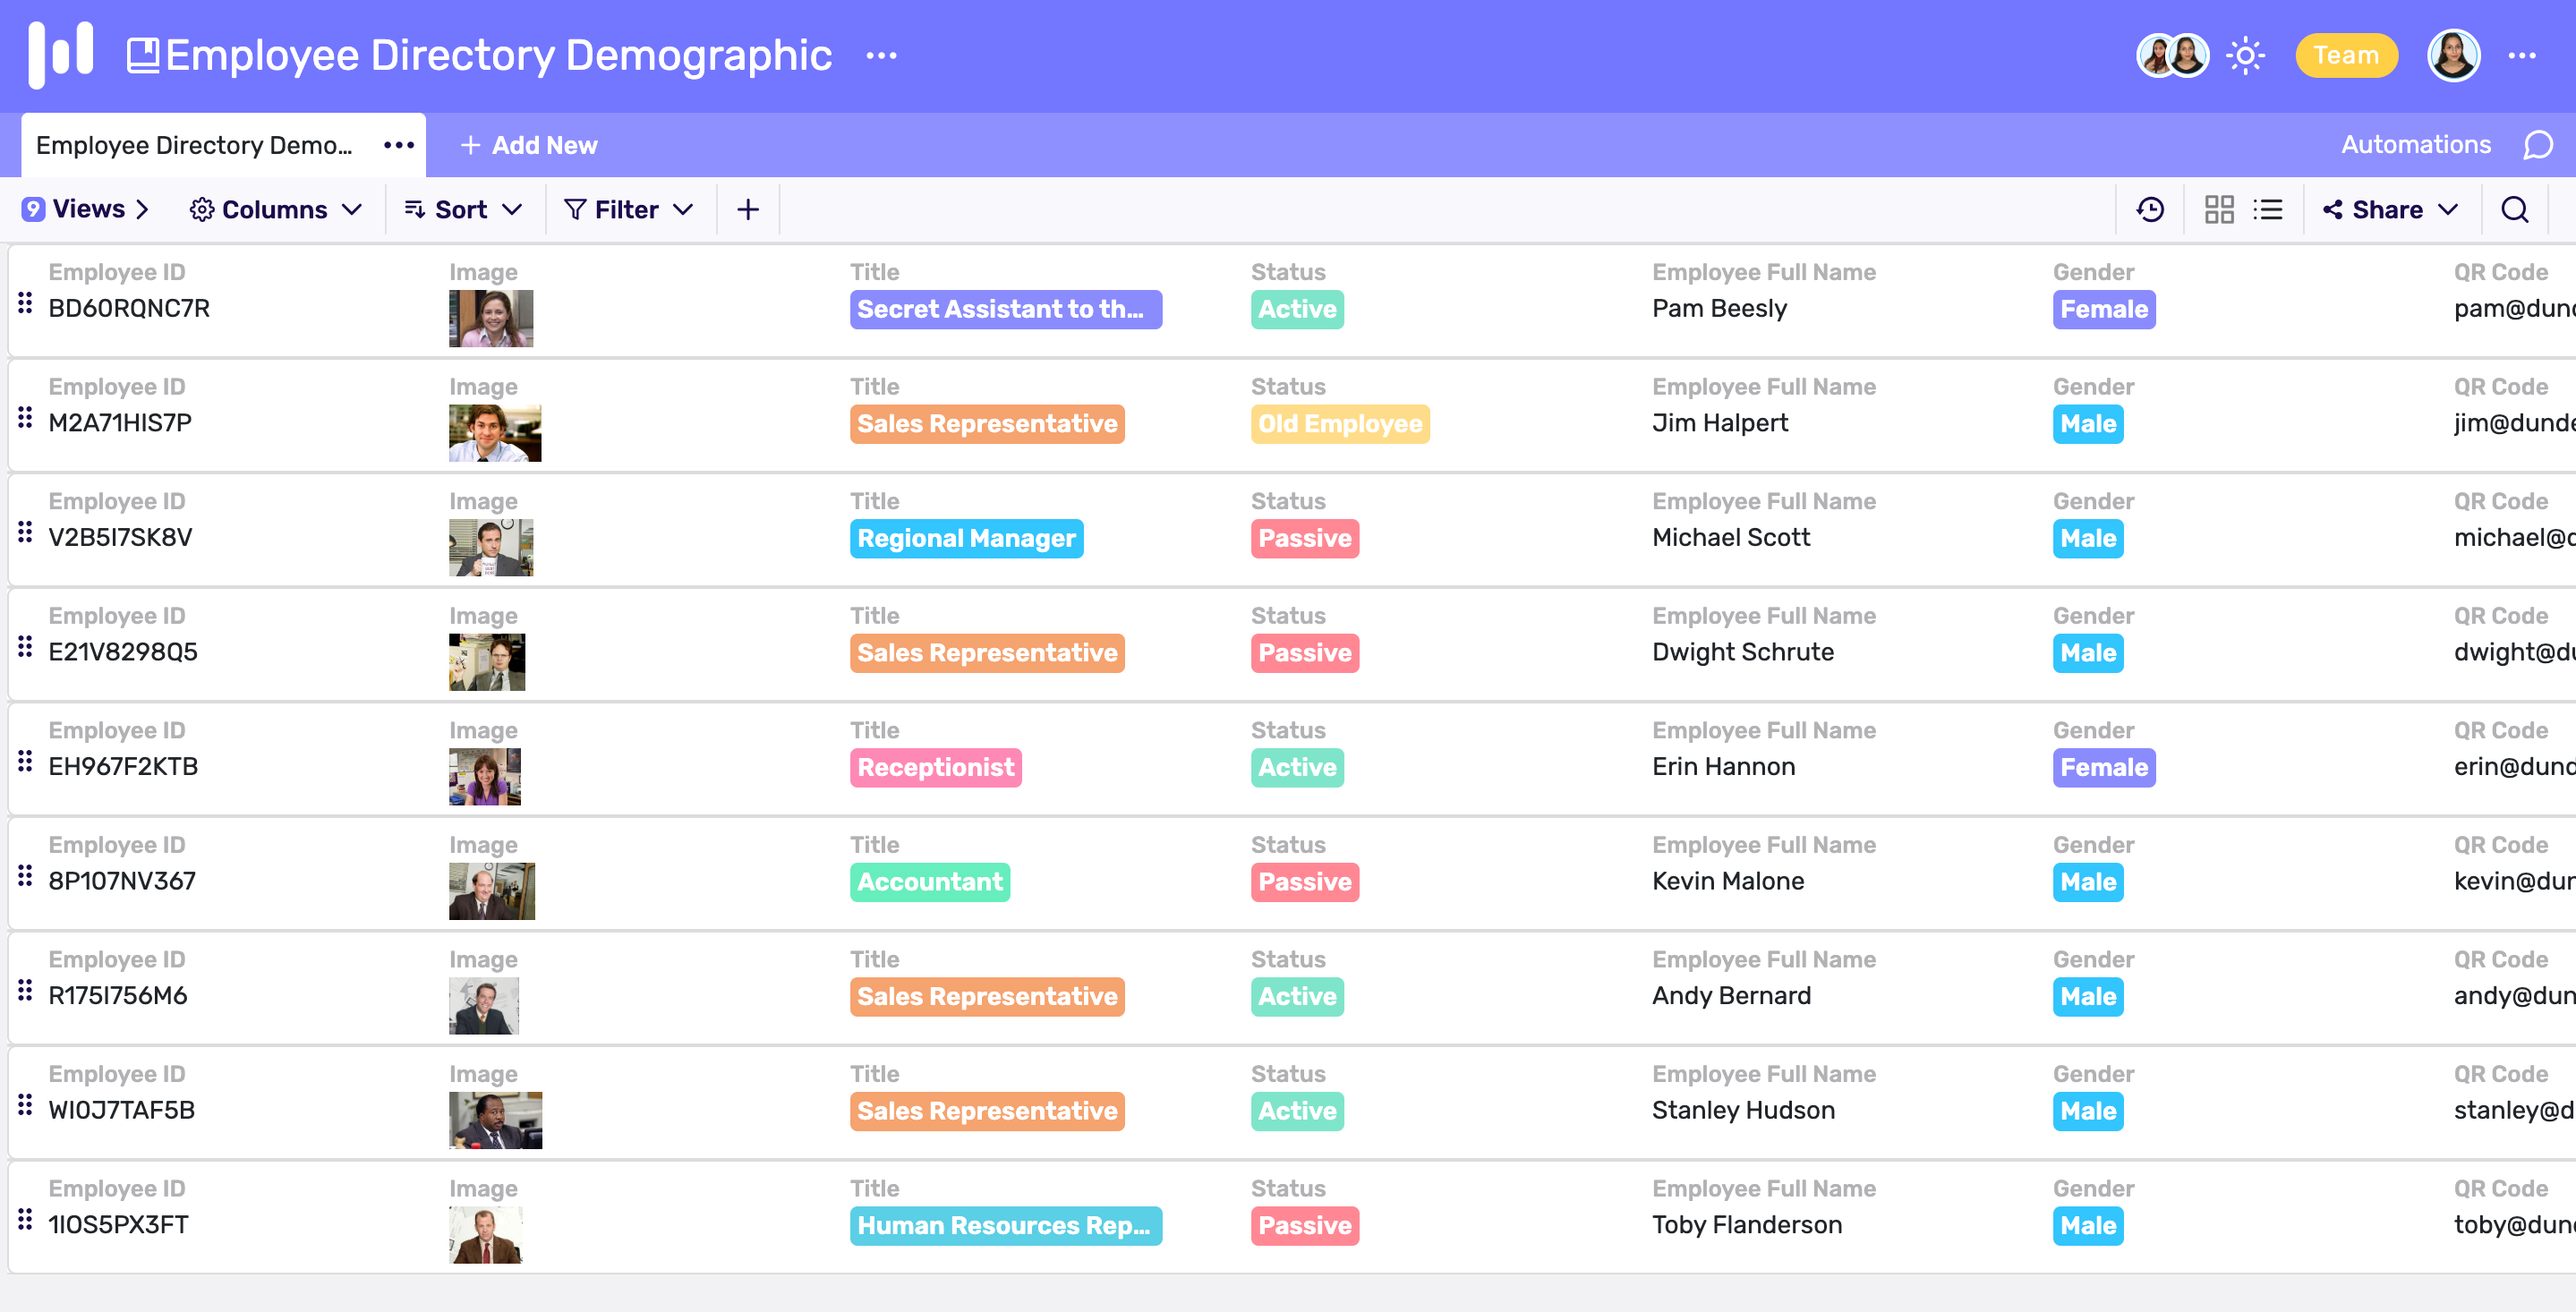
6. Card view
Card view summarizes the data in the form of a card. All the essential details the user needs to know will be displayed on the card. If one needs a detailed look at the data, the card can be clicked, which will enlarge into a detailed snapshot of all the information entered.

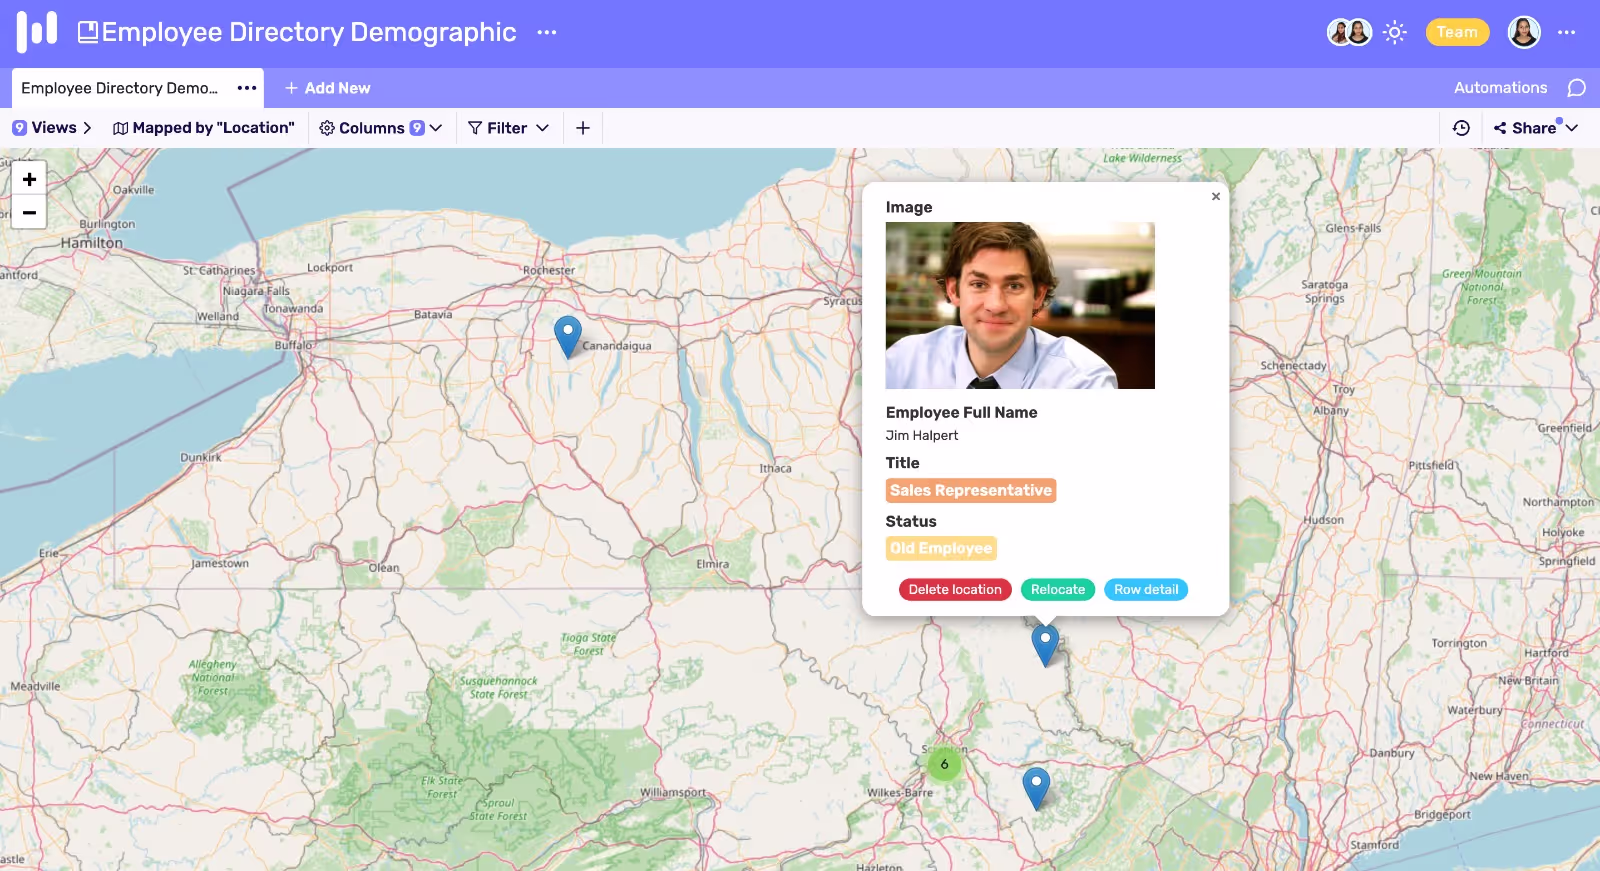
7. Map view
Map View easily shows you the locations you selected on the map and gives you the density of the records by location. Thanks to the colors on the map, you can easily see the density and the number of records in the regions. You can also view the details of these records by clicking on the pins on the map.
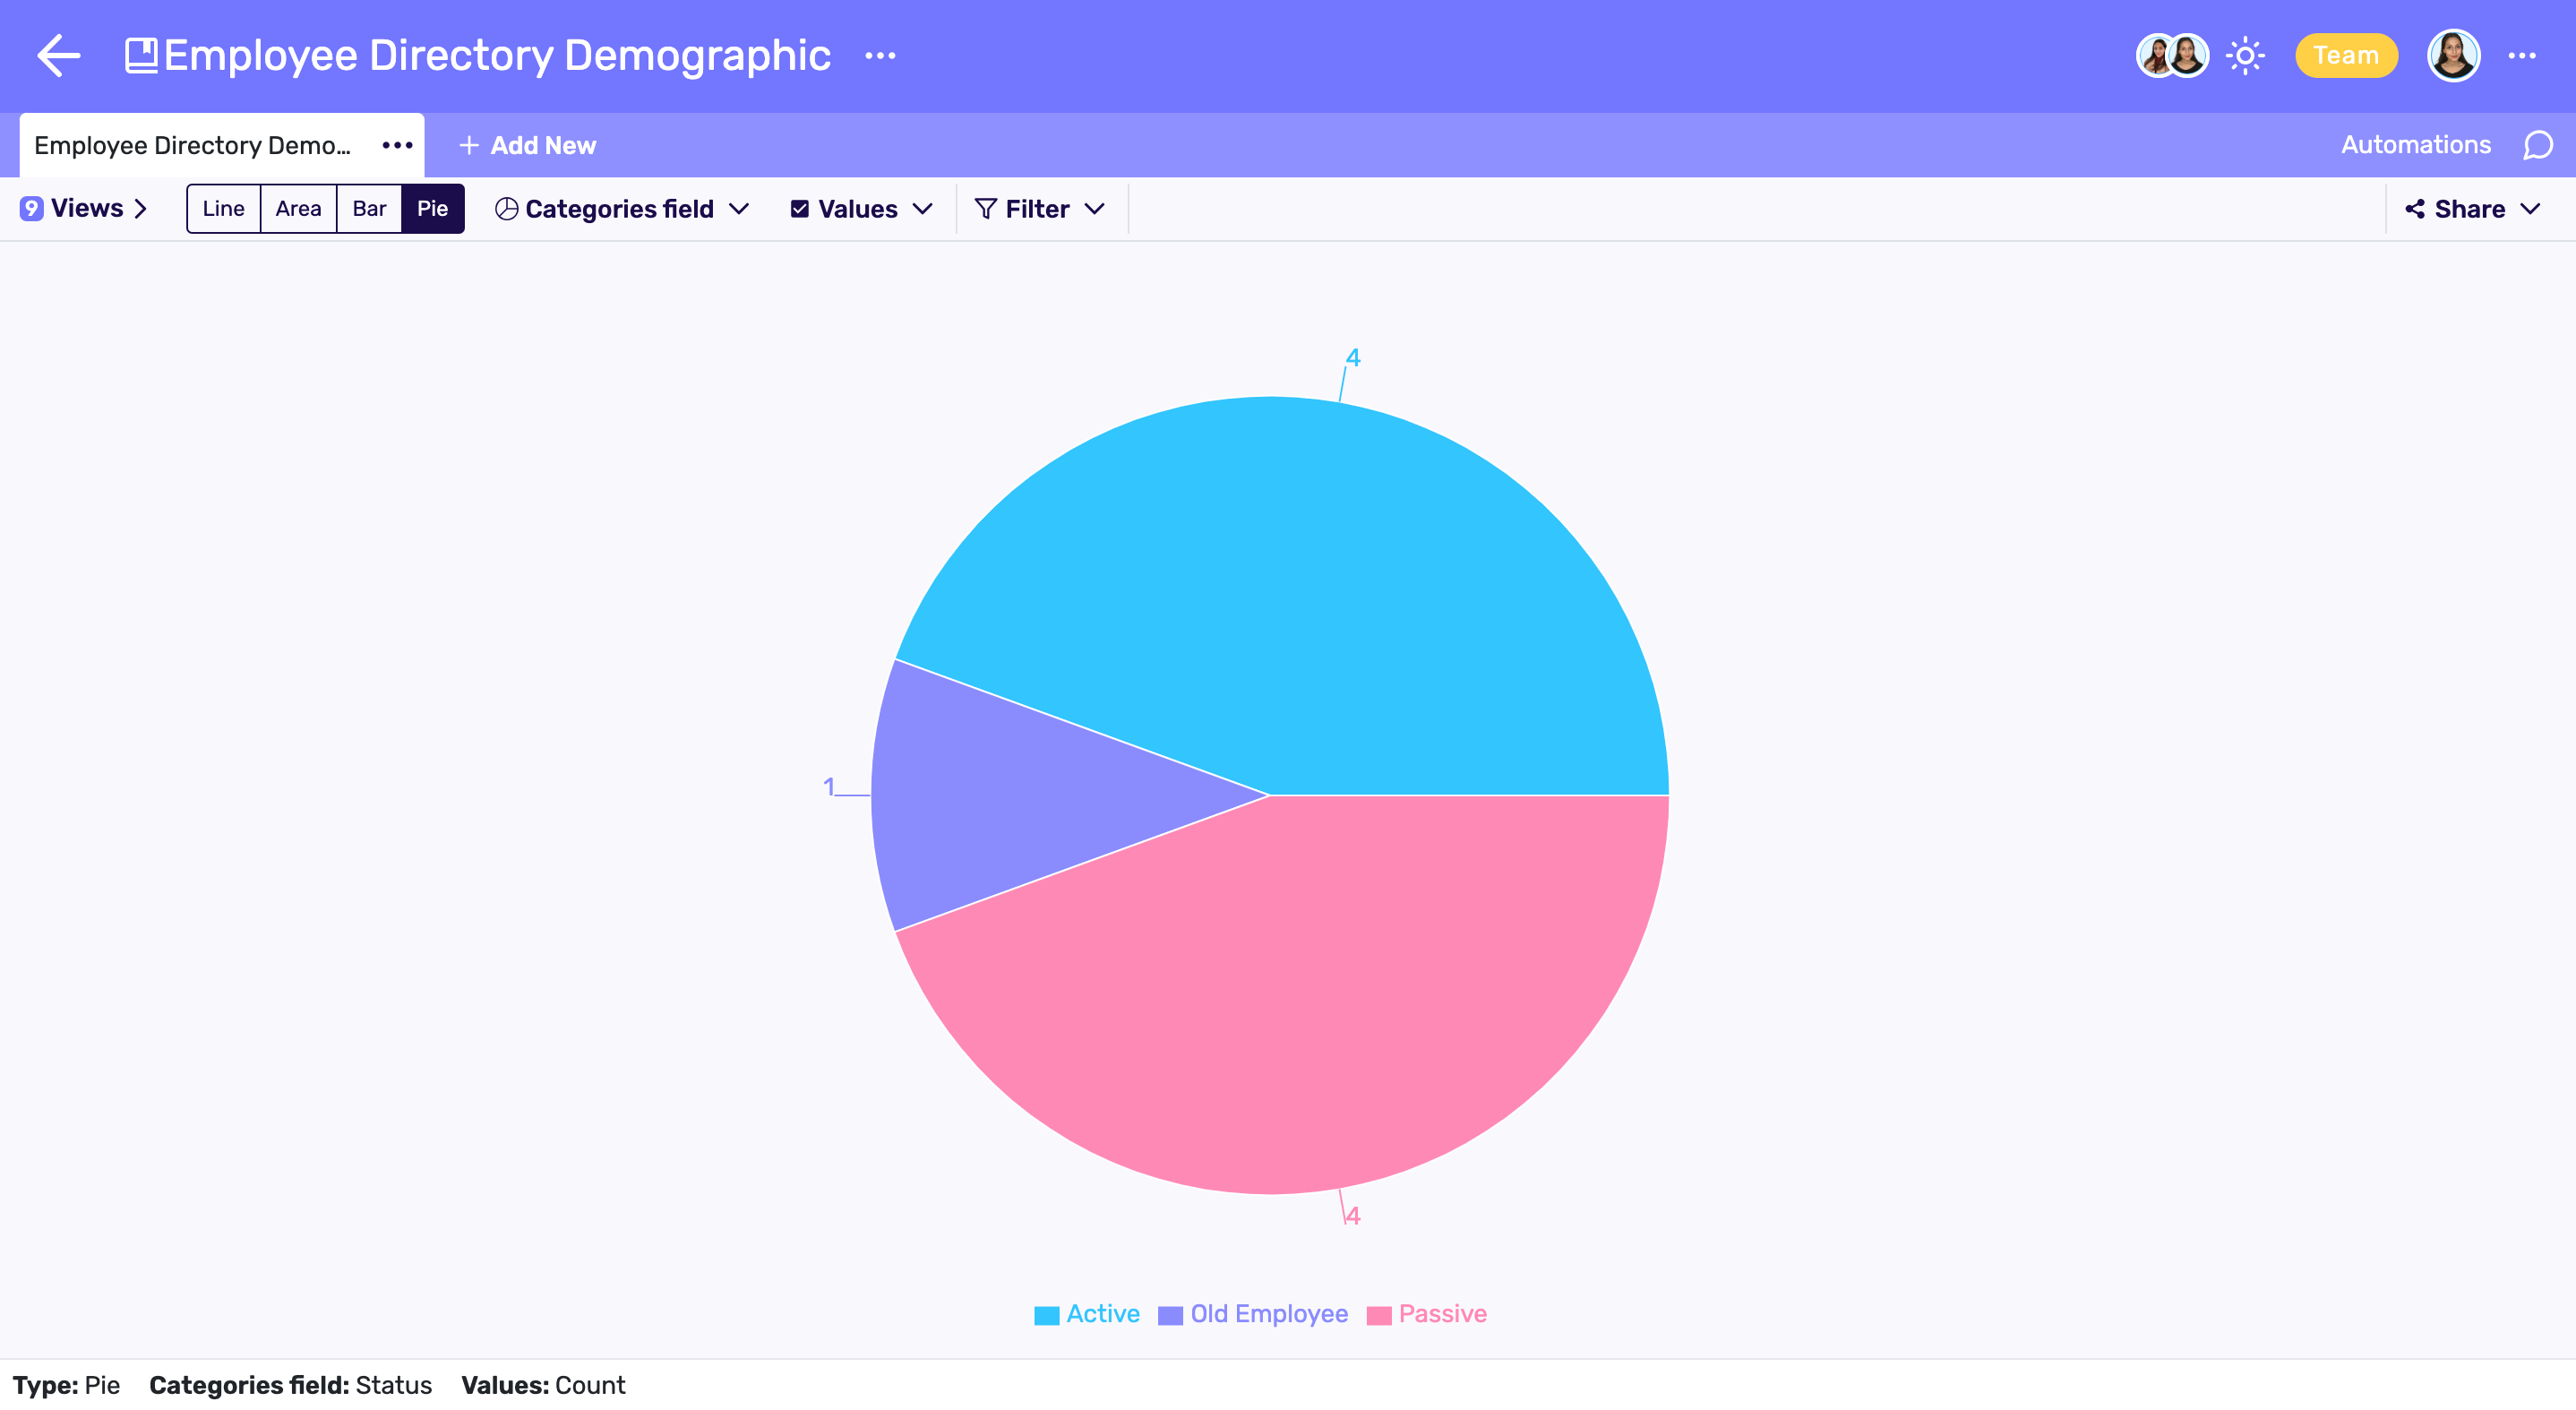
8. Chart view
The chart view summarizes a spreadsheet's data and helps you to visualize your records in multiple chart types including bar chart, line chart, area chart, pie chart.
How to create a custom view?
Retable’s custom views are easy to create. It is self descriptive and you don't have to scroll around searching for the required view you need for your data.
Once you finish creating your workspace in Retable, it allows you a list of 8 different types of views.
From the left of the page, click on ‘Add a view’. You can choose your desired view for your information from here.
Once you select your view, each view lets you another set of options to display your data. This includes filtering, sorting, grouping, formatting etc. From the top of the view you could select your desired option to depict the data according to your ease.
You could also search out data from the search button provided on the top right corner of the view.
Conclusion
Retable spreadsheets allow various advanced features for individuals and teams to work collaboratively. The multiple views designed are a few of many advanced features designed by the team. One gets to create and customize their own style of work representations with retable. This is what makes us unique.
Frequently Asked Questions
What are custom views?
Custom views on a spreadsheet are a way to make the information appear the way one likes it to be. This is done mostly for the ease of managing and organizing data and to visualize according to one’s own ease.
What are the views used in Excel?
There are different type of views including, gird view, Gantt view, and Form views for capturing data.
What are the best views available in a spreadsheet?
The best views available are grid view, list view, kanban view, card view, chart view, calendar view, form view and map view.
more
Related Resources


Create your smart data management solution
Plan, track, and analyse with your ease. Transform your data with an all-in-one platform, collaborate with your teammates.
Try for free!