.avif)

Have you ever found yourself staring at a screen full of data, thinking “There has to be a better way to see this?” Guess what? Retable heard you loud and clear! Introducing a game-changer in the world of data visualization with view options. Each option is designed to make your data not only more accessible but downright engaging.
Let’s dive in and see how each view can transform the way you interact with your data.
Table of contents
- How to create a new Retable view
- How to share a Retable view
- Grid view
- Form view
- Calendar view
- Kanban view
- Chart view
- Map view
- Card view
- List view
How to create a new Retable view
To create a new Retable view you should navigate to the left sidebar on your table and select the view type you want to create. If your views sidebar is collapsed, you will need to first expand it.
How to share a Retable view
There are couple of ways to share a Retable view:
- Invite collaborators to your Retable project: When you add a collaborator to your Retable project, they can see all of the information in your project, which means every table and every view.
- Share read-only public view: If you don’t need to share all the project details with someone you can share a specific view that updates in real-time with a read-only link. So, anyone can view your specific data views. You can simply click the "Share" icon at upper right corner of your view and activate the "Create link to view" toggle. Then, you can copy the view-only link of your Retable view. When people use the URL you created, they can only see the data that is visible in that specific view. They can not see the data beyond what’s in the shared view. Also, if you make any updates, these changes will automatically be reflected in the shared view in real-time. So, your view will always stay up to date.
- Share editable public view: Similar to read-only public views, you can also share your views by allowting the editing. So, people can edit your specific views by using the shared URL. You can simply click the "Share" icon at upper right corner of your view and activate the "Create link to view" toggle. Then, you need to activate the "Make this table editable" toggle. If you select the "All" option people also can edit your view settings like column types, formatting, sorting, filter etc. But if you select the "Only data" option, people can only edit your data within the cells. Remember that, people must be logged in to Retable to edit your shared views.
Quick tips:
- Public view links are are accessible by anyone visiting the URL, and the data in the view can be exported. You can disable the export option by activation the "disable export" toggle from the share panel.
- You have the option for hiding Retable's toolbar for your shared public view. So people can not access your toolbar settings and Retable branding. Simply activate the "hide toolbar" toggle to do this.
- You can share a view a template by allowing users to copy the data in your view. You can activate the "Allow viewers to copy data" toggle to share your view as a template. So, people can copy your view directly to their own Retable projects.
- You can embed your views to any website by clicking the embedding icon located near your public share URL and copying the HTML code.
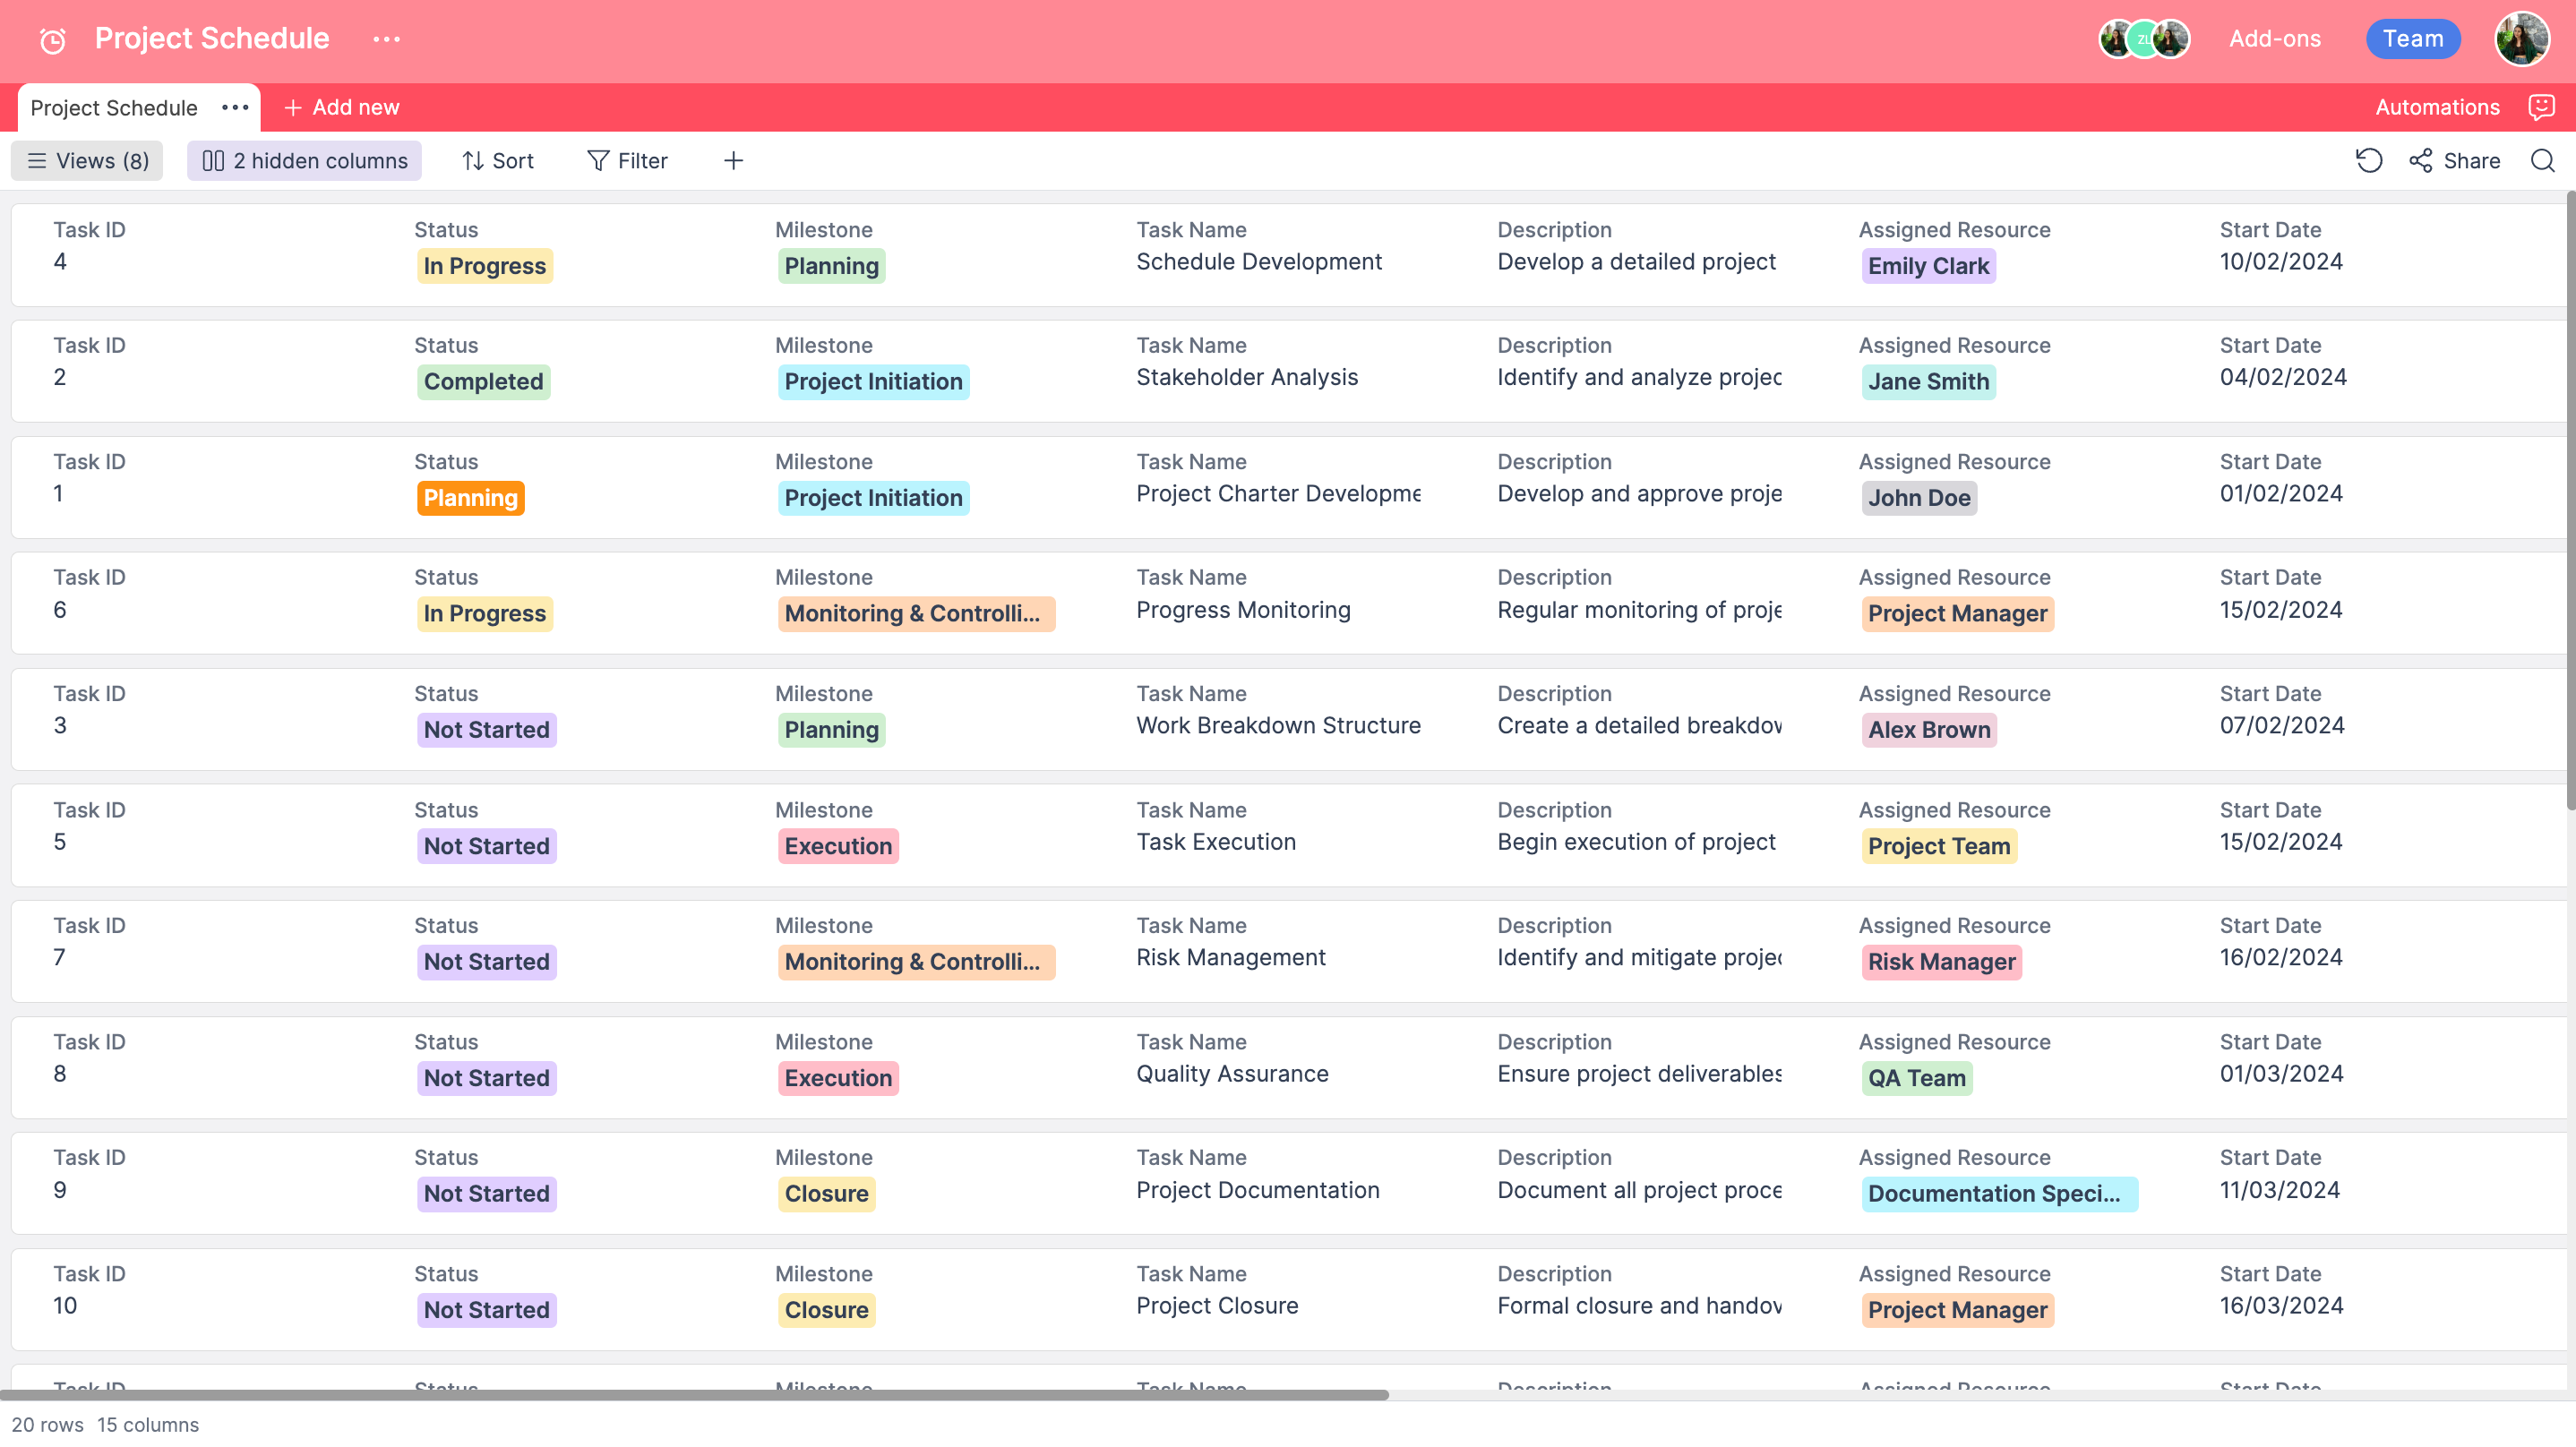
Grid view
When you open your Retable spreadsheet, the first view that welcomes you is the: Grid view.
Grid view is a view that displays your records as rows and your fields as columns. It is very versatile and beneficial when you try to add new data to your table. Each table must have at least one grid view as default. If you have a table with many rows or columns, you can create a view that will hide, sort, filter, group, or format certain rows or columns and make the table easier to navigate.

By clicking on “Columns” menu from the toolbar you can easily organize, order, and hide all your columns in one place. You can apply conditional formatting based on cells and rows according to the condition. You can also drag and drop your rows in addition to creating a public view for your grid view like the other views in Retable.
Retable allows you to create as many grid views as you want and customize each grid view differently, so you do not need to change the filters, groupings, and sortings you make each time, and you can continue to work with the settings saved in the grid view you need, this is valid for all views.
Form view
Now let’s take a look at the Form view. Retable's online forms let you collect information from anyone and save it automatically to a Retable table. To create smart online forms from your spreadsheets, you can now easily switch between your spreadsheet and online form. Retable forms are automatically generated from your existing tables and then give you the ability to rearrange and remove fields.
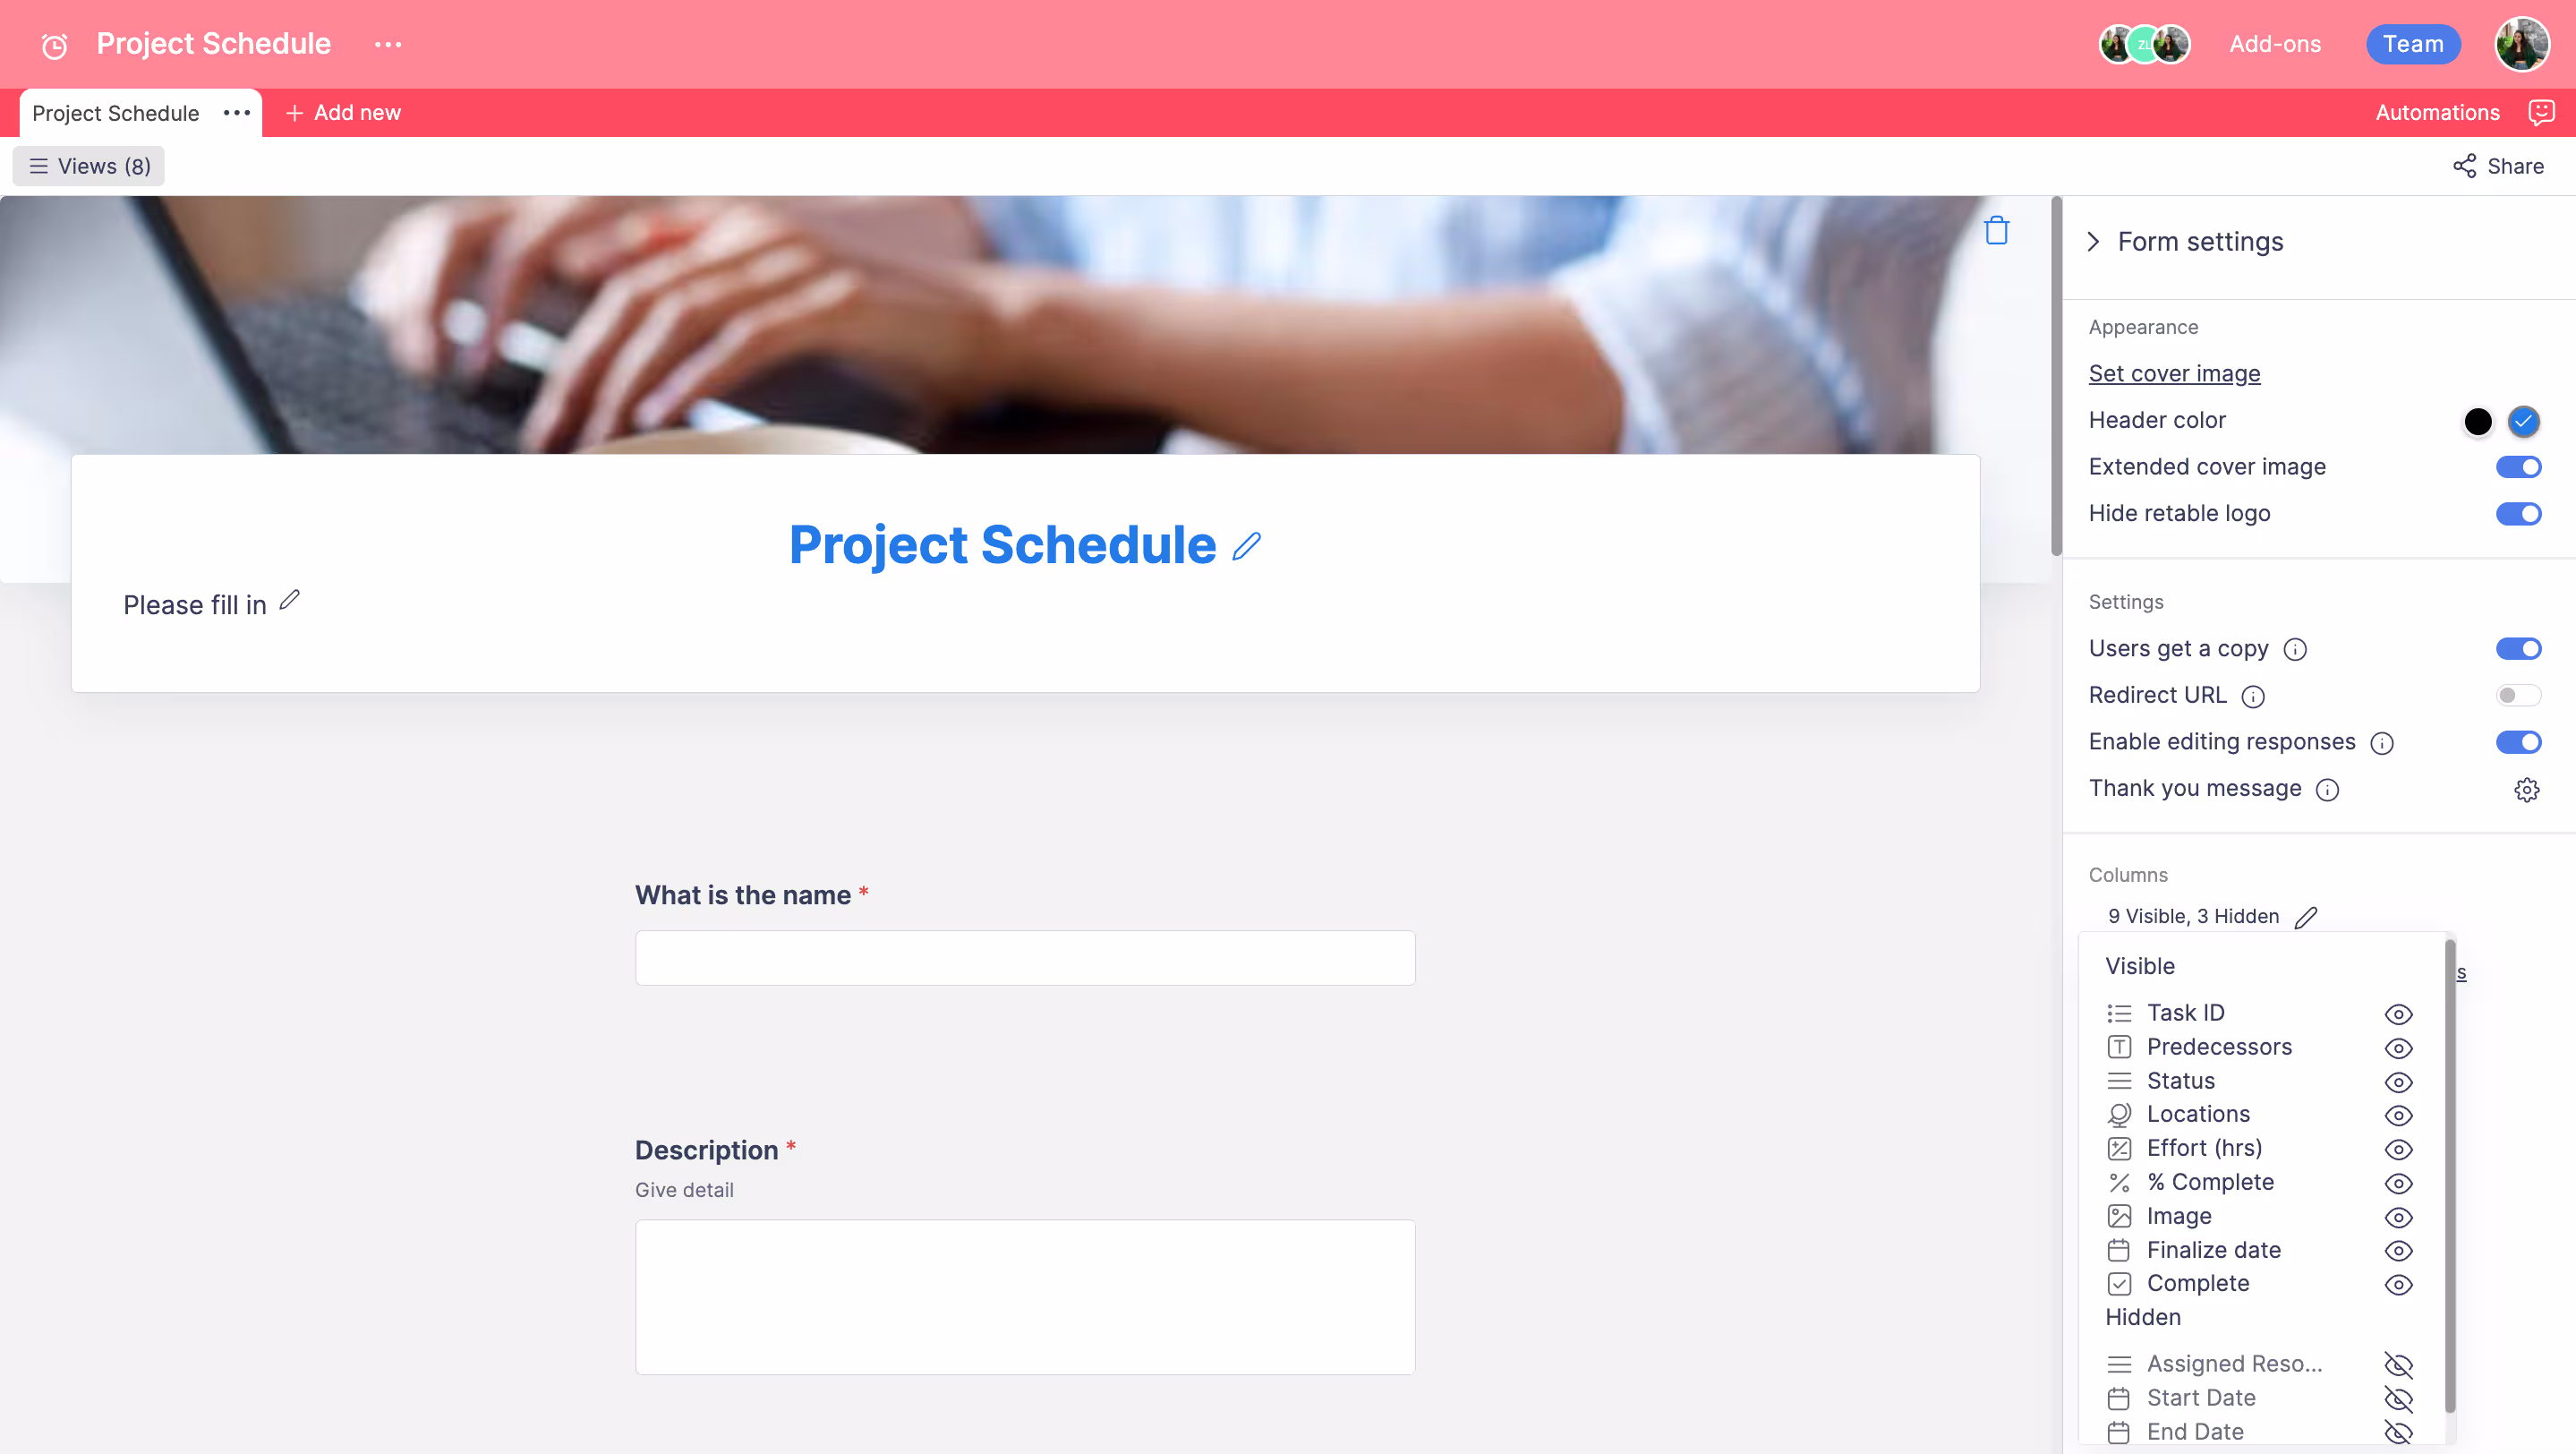
You can add a cover image to your form by selecting or dragging from the “Click to upload or drag and drop” field which will look like a cover image for your form. You can also add a headline and a description to your form. Every response given in your form will automatically appear as a line to your spreadsheet.
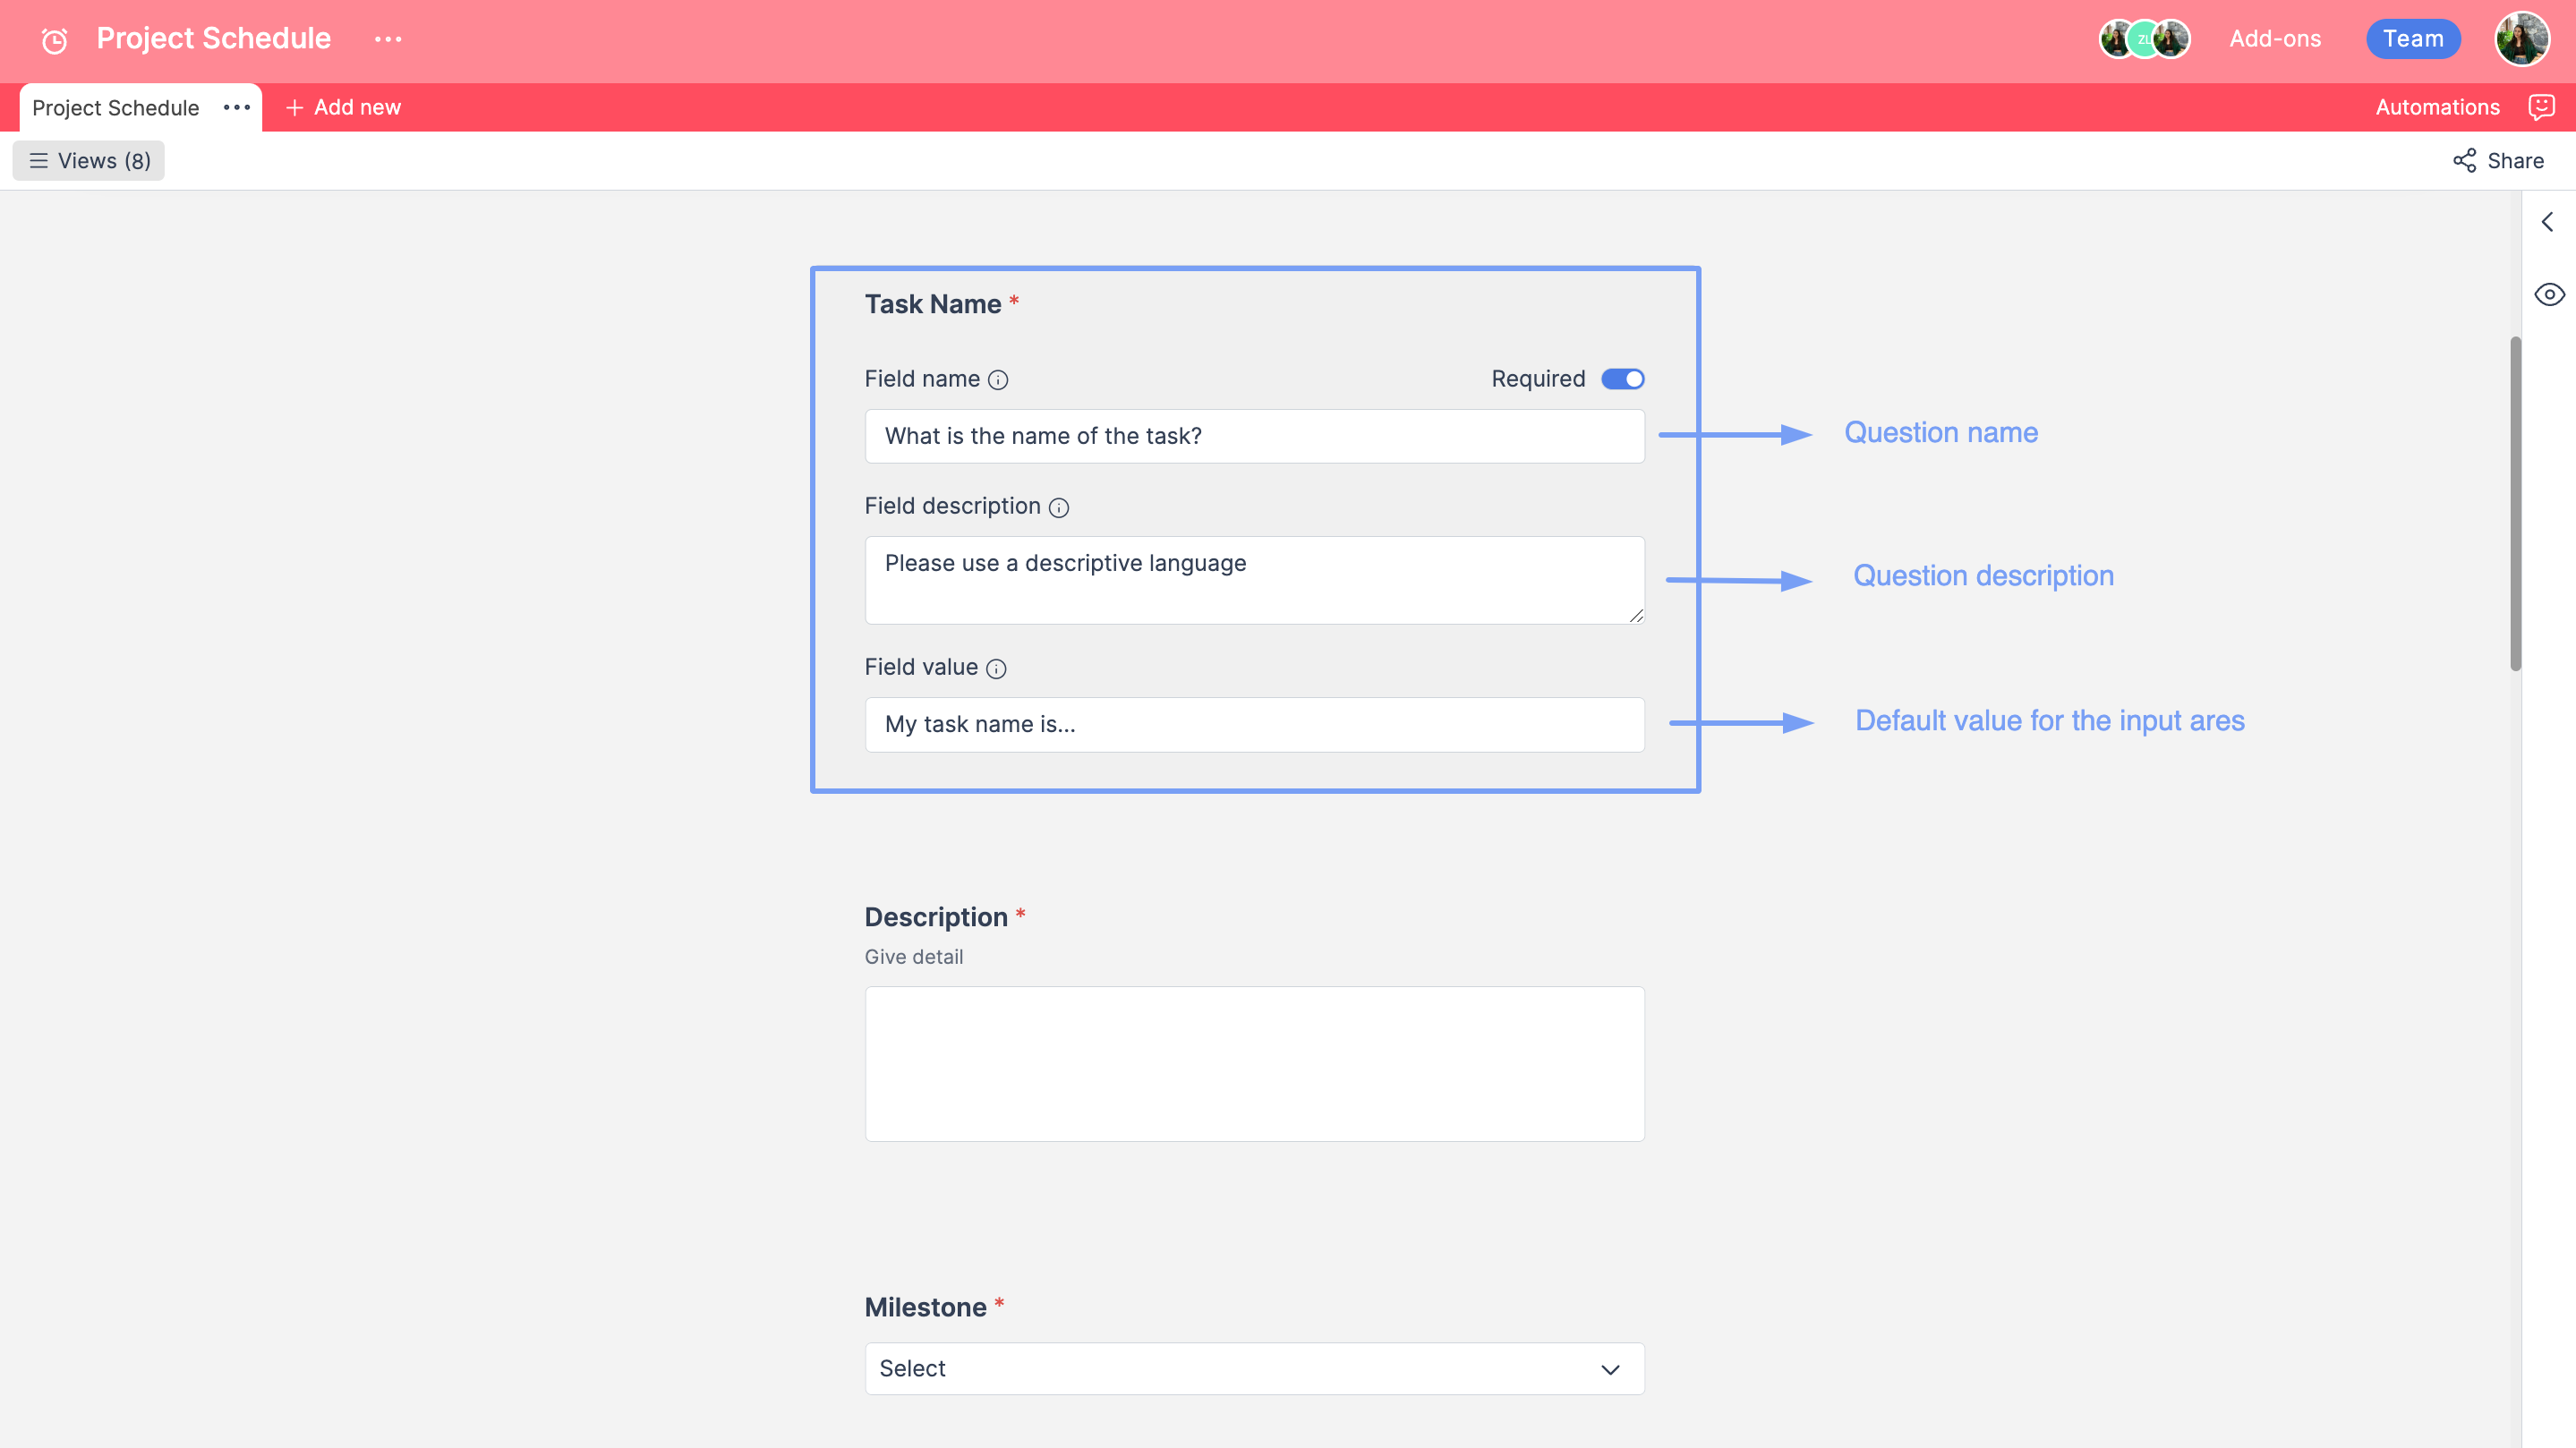
You have the option to change the column name and add descriptions by clicking on the field, making the column required which in this case, the field will be mandatory and cannot be left empty. You can drag and drop the questions and change the alignment only on the form. The alignment changes will not be reflected on your original spreadsheet.

On the right-hand side, you can see that Retable gives you the option to change header colors, extend the cover image, hide the Retable logo, make the users get a copy of the form, enable editing responses, add a thank you message, and redirect URLs. You also have the option to hide some of the existing columns in your spreadsheet and make them invisible. After you’re done editing your form, you can click on the “preview” button to see the final result of your form. If you are happy with your form, you can share it by activating the “enable public form” toggle, and now your form is ready to go.
Last but not least, you can embed your forms into any website. When you click the share button and choose the “embed your form on your web page” icon, the embed pop-up window will open. You can directly copy the code to paste it to your website. You can customize the width and height of your form as you like.
Calendar view
Next on to the Calendar view: Retable calendar view is designed in a way that teams can get more insights from data records. It is now possible to view your important tasks, meetings, goals, expenses, and much more on the calendar. You should have a date and time column to add a calendar view to your table.
After selecting the Calendar View, you will then be prompted to select one of the table's date and time columns to use to place dates on the calendar. If you do not have a date and time column, you will be required to add a new one using the "Add a new date and time column" option.
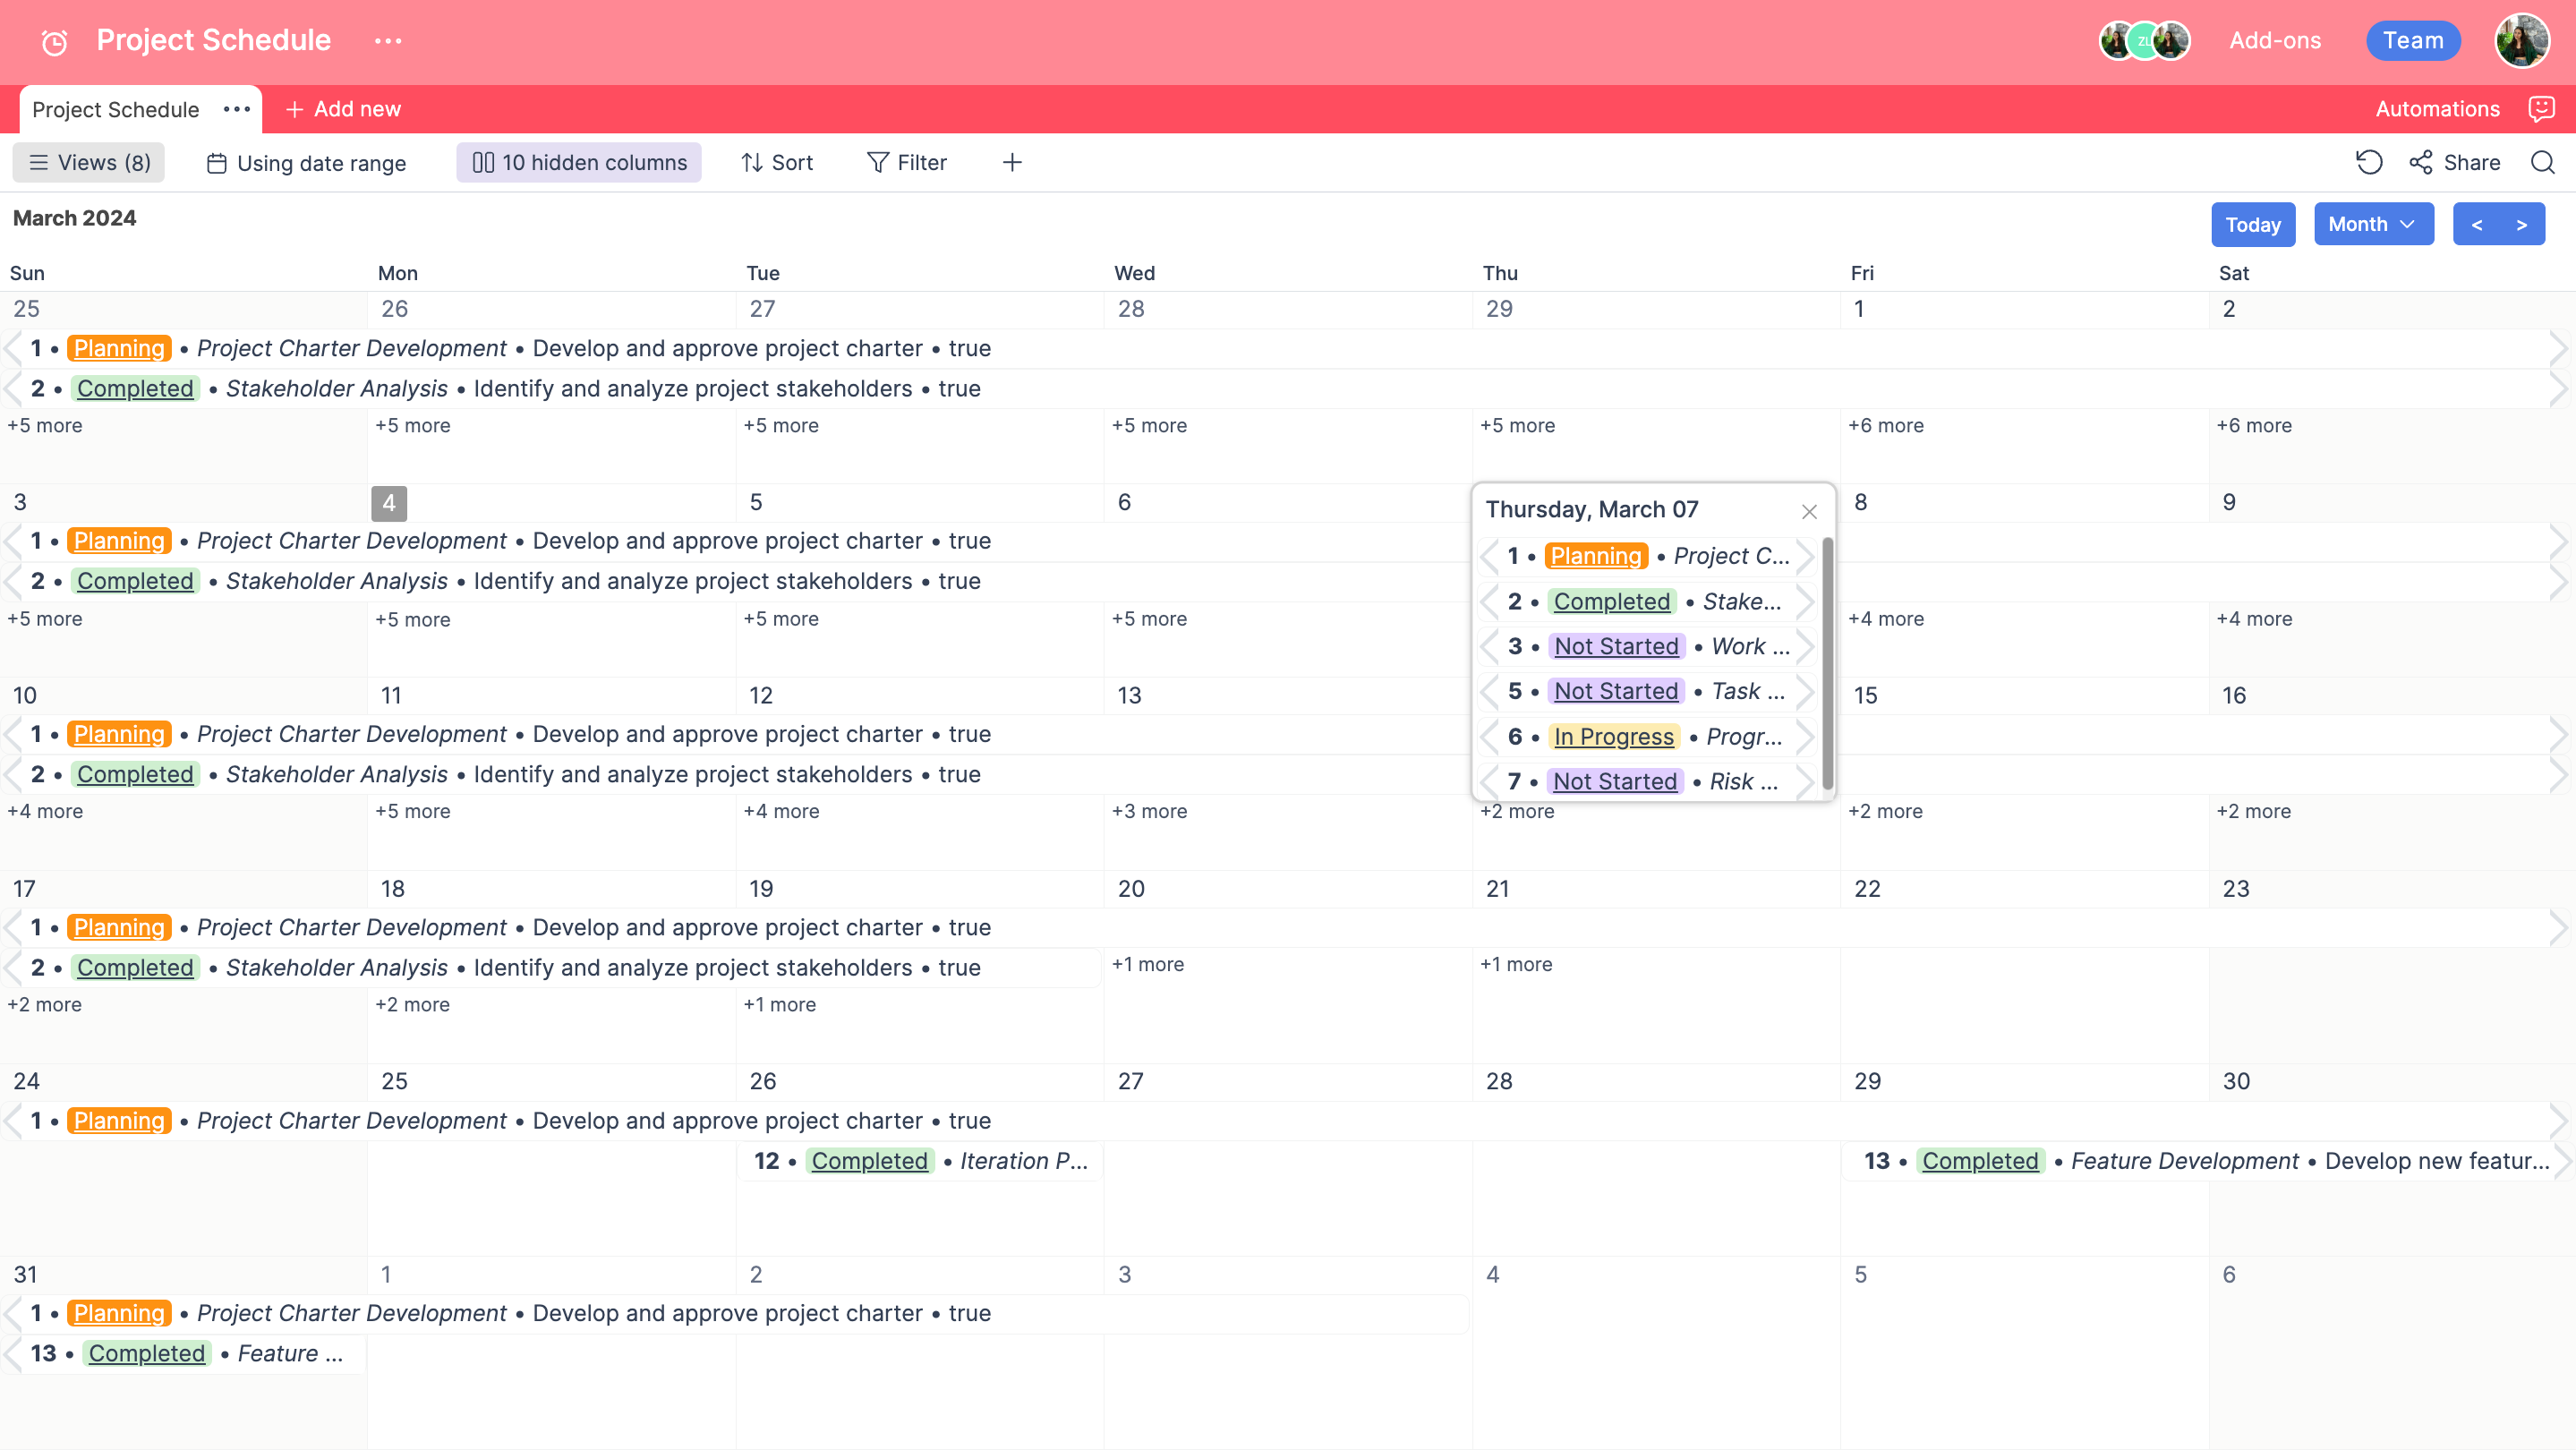
You can add new records to your table directly from the calendar by clicking the “+” icon. The records you add through the calendar are directly reflected in your table. You can continue to organize your records on the calendar. If you click on any record in your calendar, the item detail field will open, so you can edit other columns or rows of your record easily. If you have more than one date and time column in your spreadsheet, Retable will show your dates in a date range format.
You can also set your calendar as monthly, weekly and daily from the top right of your calendar.
Kanban view
Kanban view provides a more visually optimized way to update and display records in your table. Kanban boards categorize the tasks, and these tasks are organized in columns to show the status of the tasks in the project flow. After choosing the column you want to sort your data by, Retable will automatically generate a Kanban board based on your column data. You can also sort & filter your data in the Kanban view.

You can add new records to your table directly from the kanban by clicking the “+” icon. The records you add through the kanban are directly reflected in your table. You can drag and drop your cards on the Kanban view. Remember that your Kanban cards will be categorized by the options you selected in your original spreadsheet. You can continue to organize your records on the kanban. If you click on any record in your kanban, the item detail field will open, so you can edit other columns or rows of your record.
If you click the "Add new" option icon at the top right of the Kanban cards, you can add a new option to your single select column. This way, you can add a new option to your Kanban. Instead of adding a new select option, you can create a new stack by simply dragging and dropping the records in your Kanban board and quickly giving it a name. If the item is drag and drop to the Add new stack field, a new stack is created. You can move cards between columns as the status of your tasks changes. This way you can easily manage all the progress of a task through a single dashboard.
Chart view
Moving on with the Chart view. Chart view is one of the most convenient ways if you're looking to build a colorful chart and get a big-picture overview of a table. The Chart view summarizes a table of records and turns it into an interactive bar, line, pie, or area chart. This way, you can make your chart pop by choosing from a set of colors. The chart lets you visualize records in multiple chart types including bar chart, line chart, area chart, and pie chart. When you select your x and y axis, then you should choose whether they’re going to be seen as ascending or descending.
Now let’s look at each chart and what can you use them for:
Line chart:
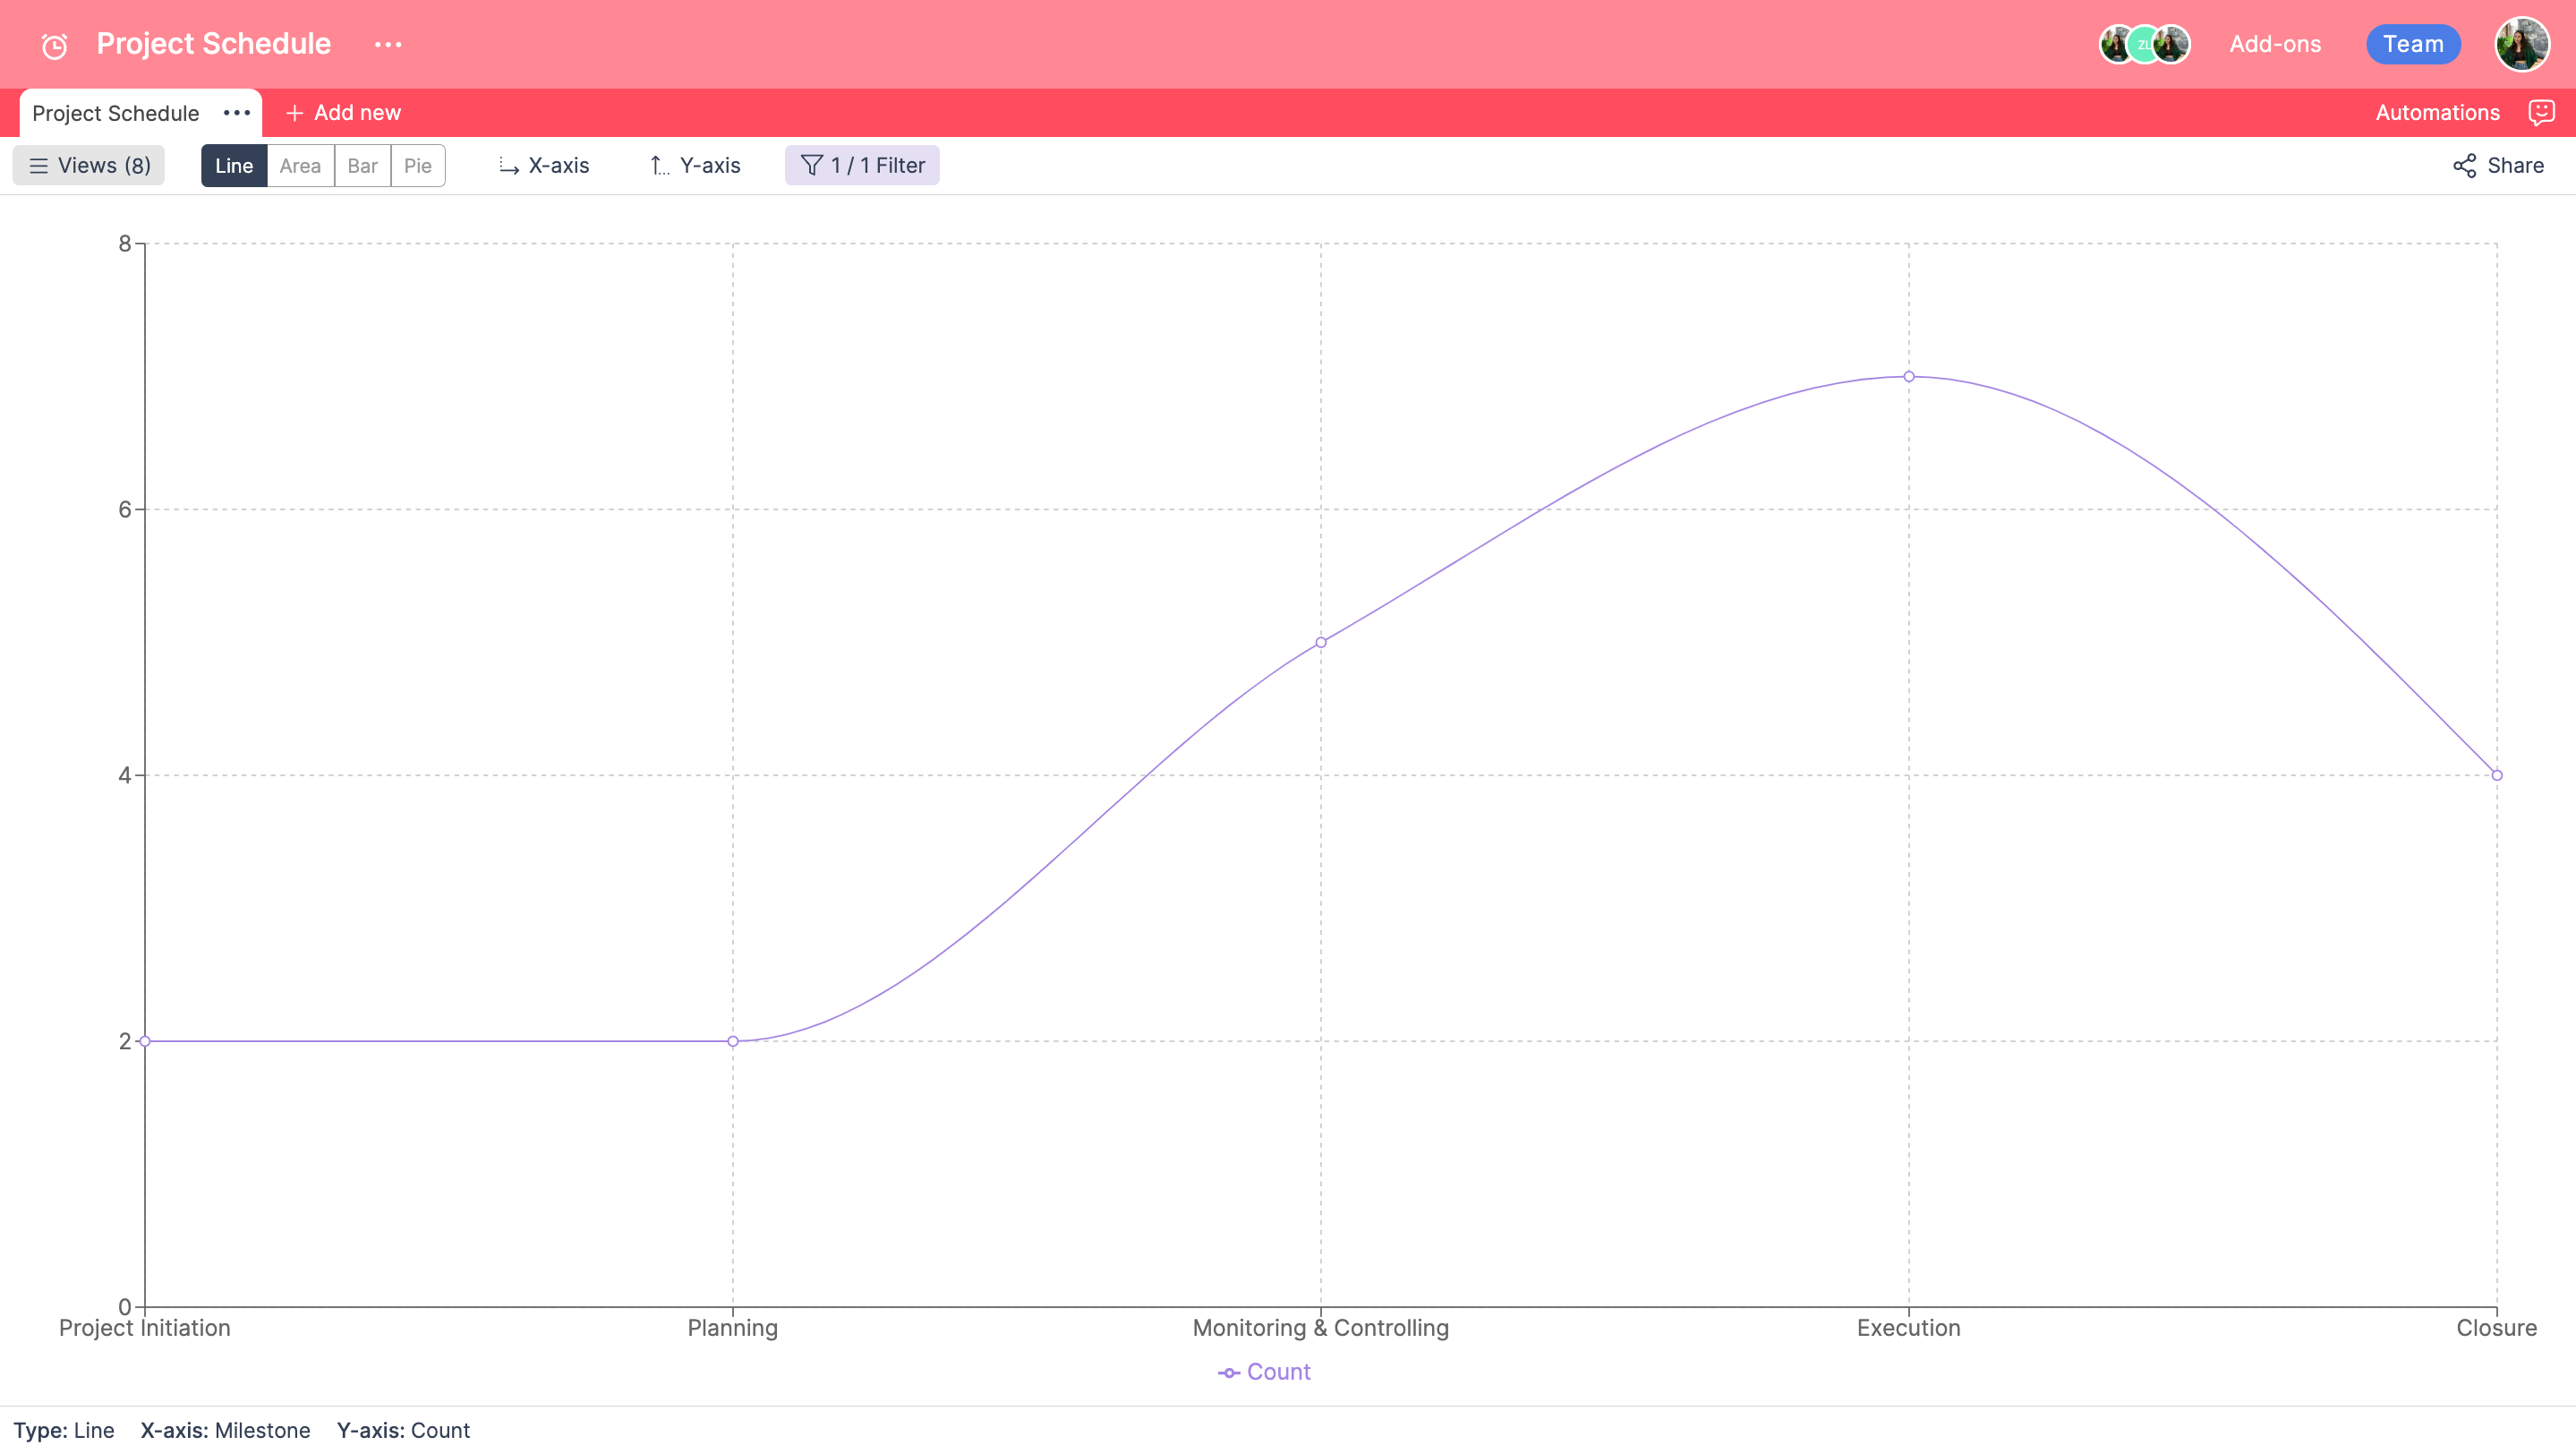
You can use line charts to track changes over time or to highlight differences and correlations within your data.
Area chart
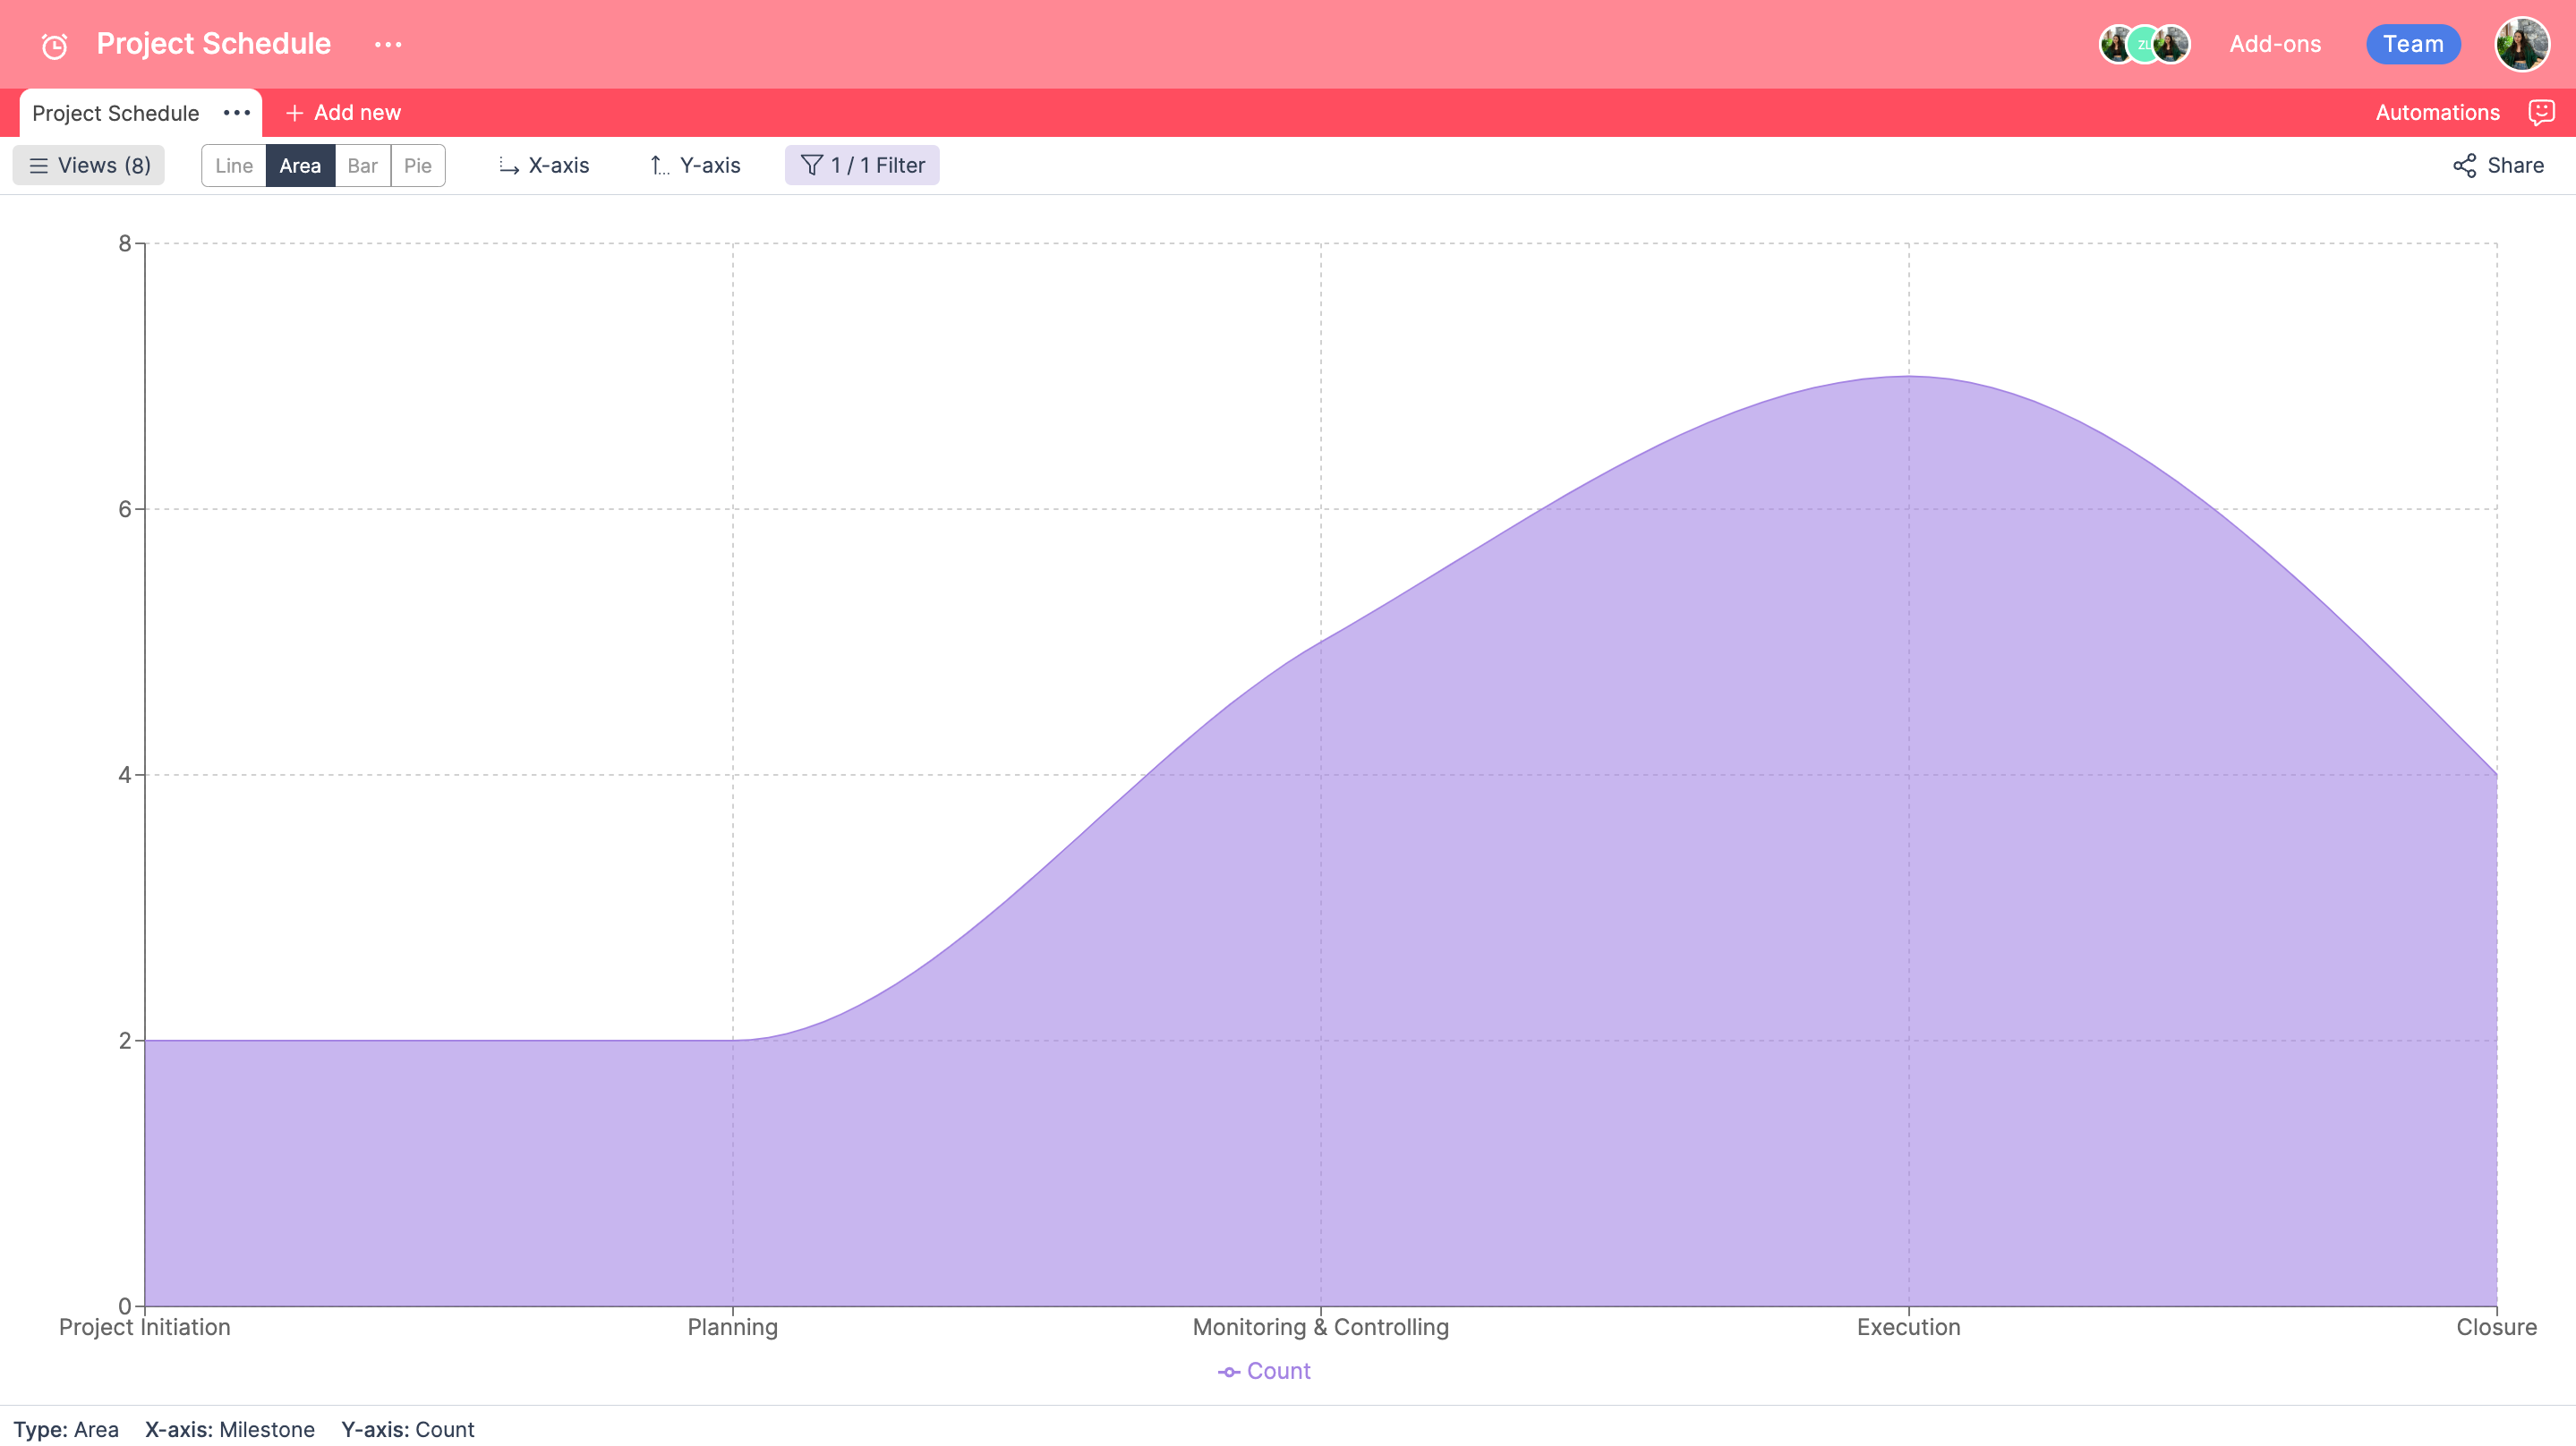
The area chart displays graphically quantitative data. It is based on the line chart. The area between the axis and line is commonly emphasized with colors, textures and hatchings.
Bar chart
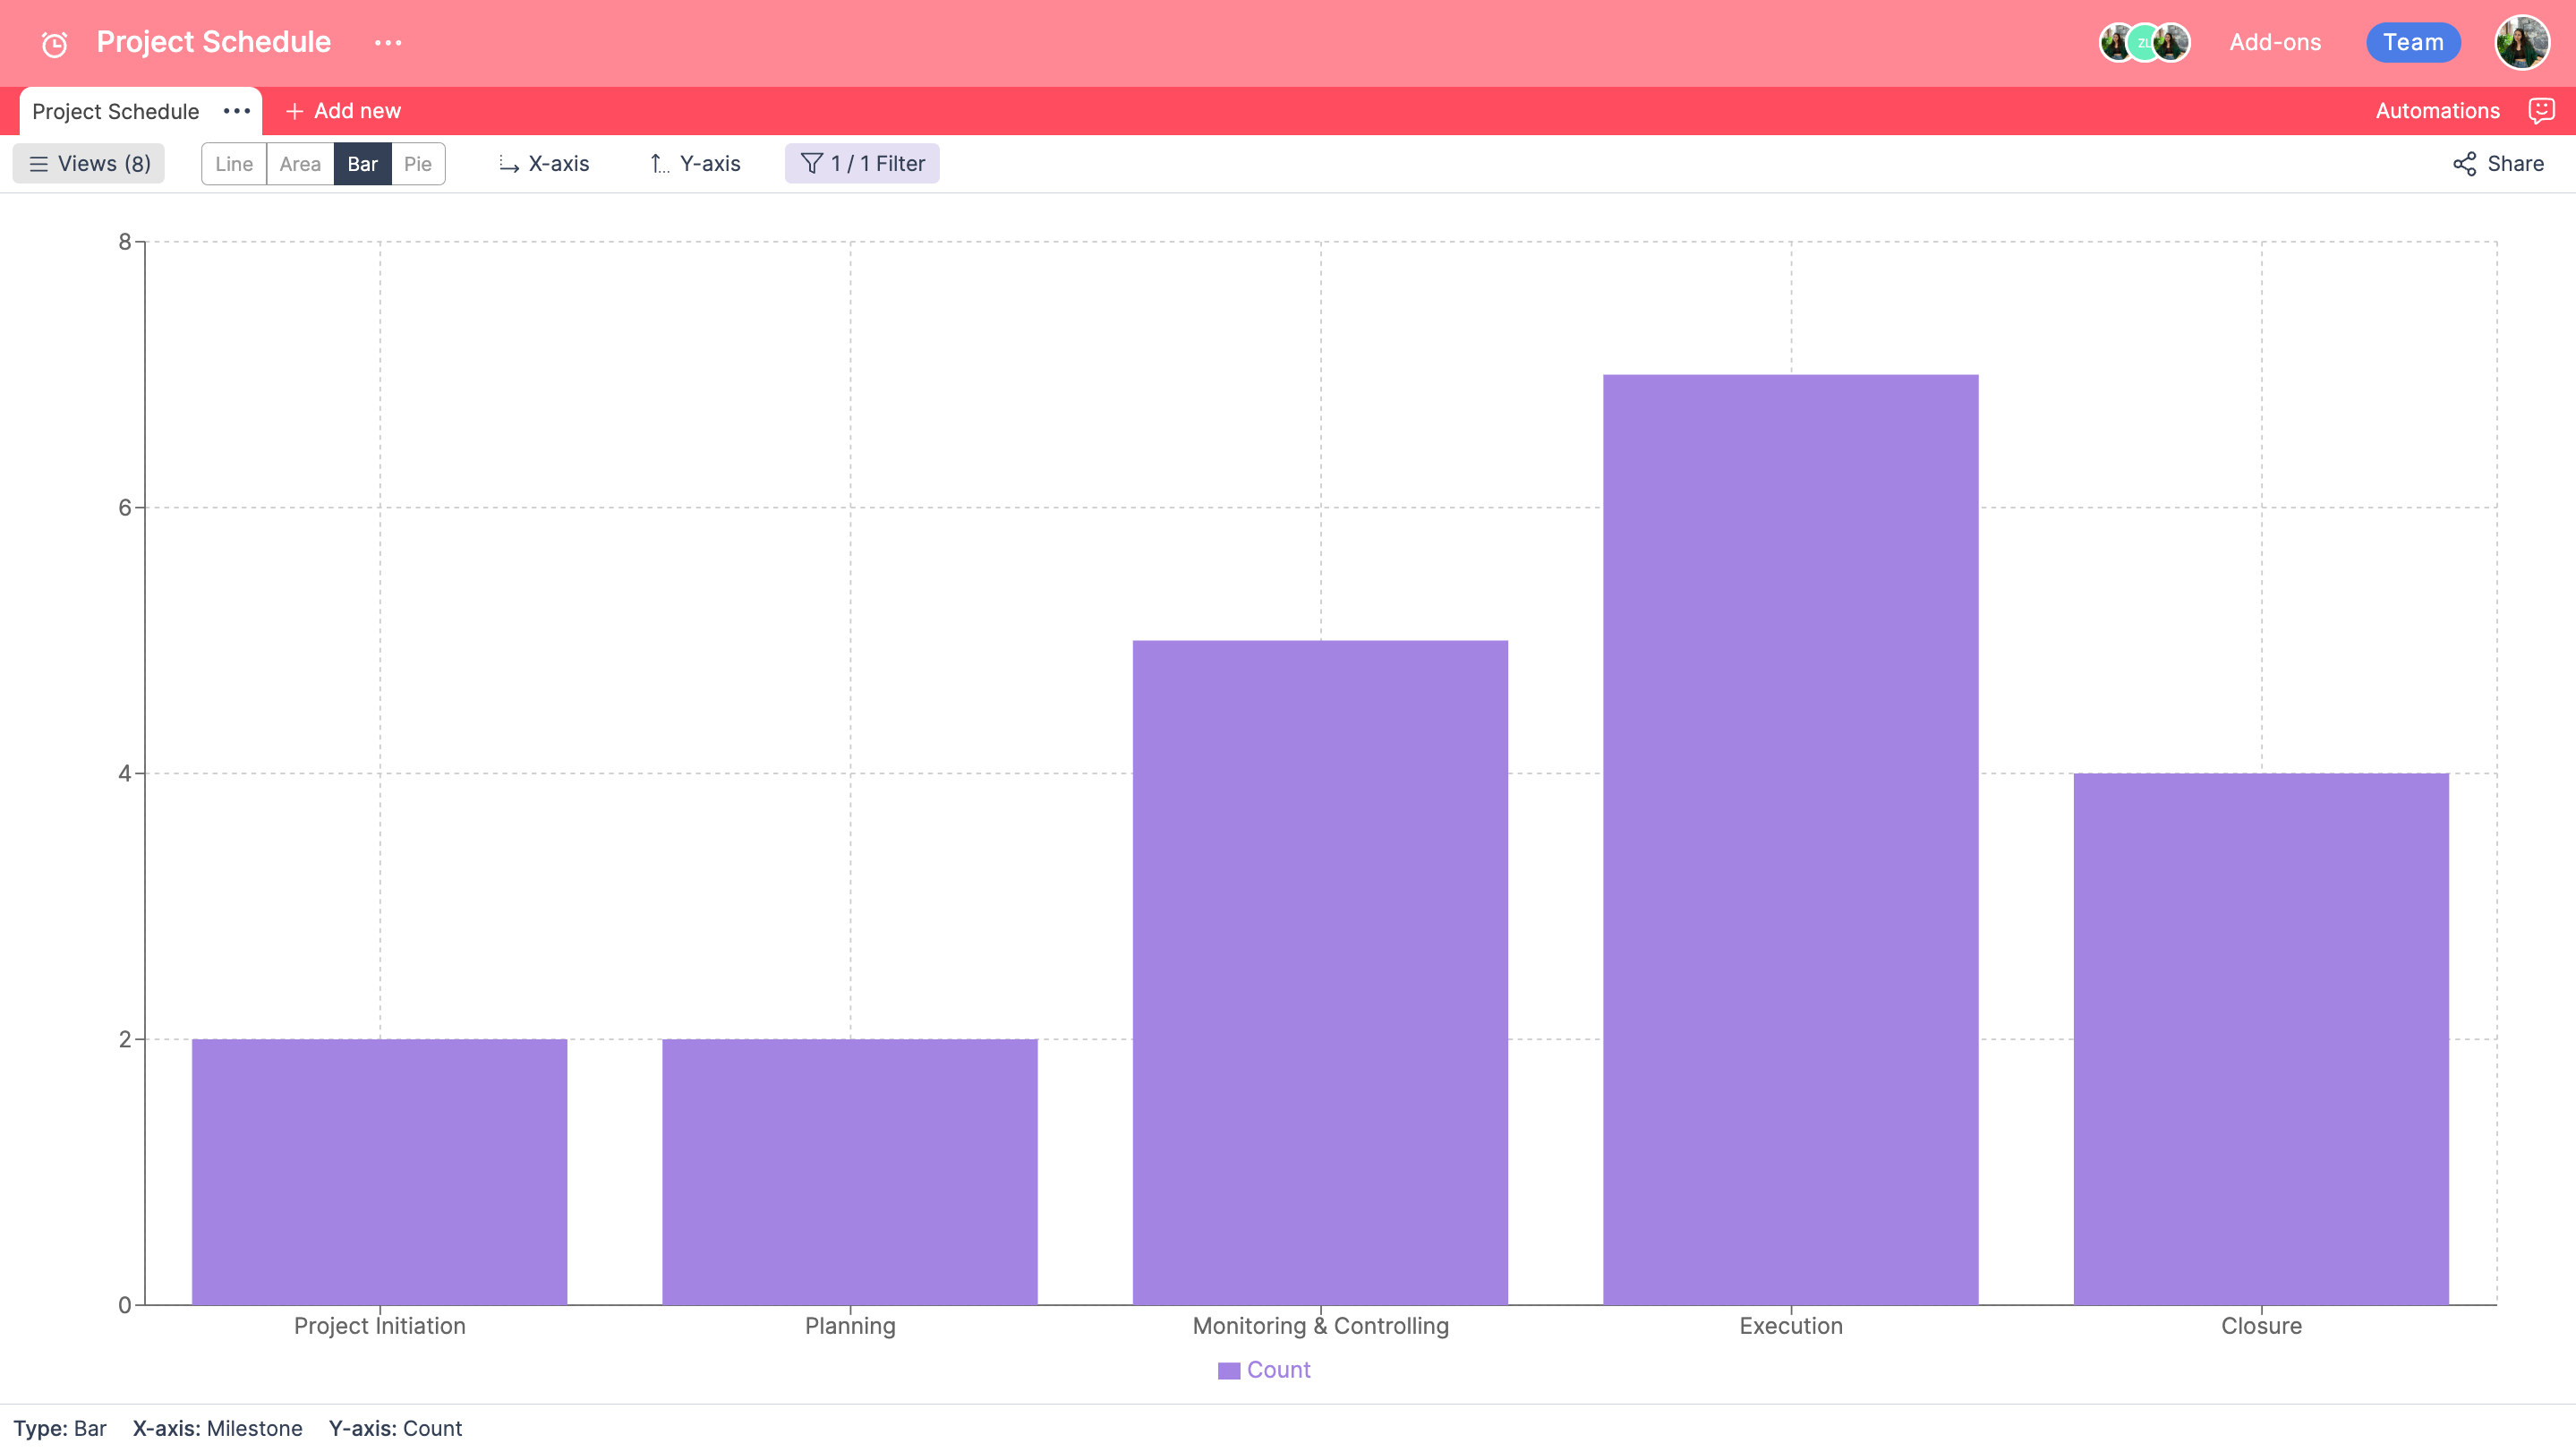
Bar charts are generally used to compare specific X-axis values, like the number of assignments each collaborator has.
Pie chart
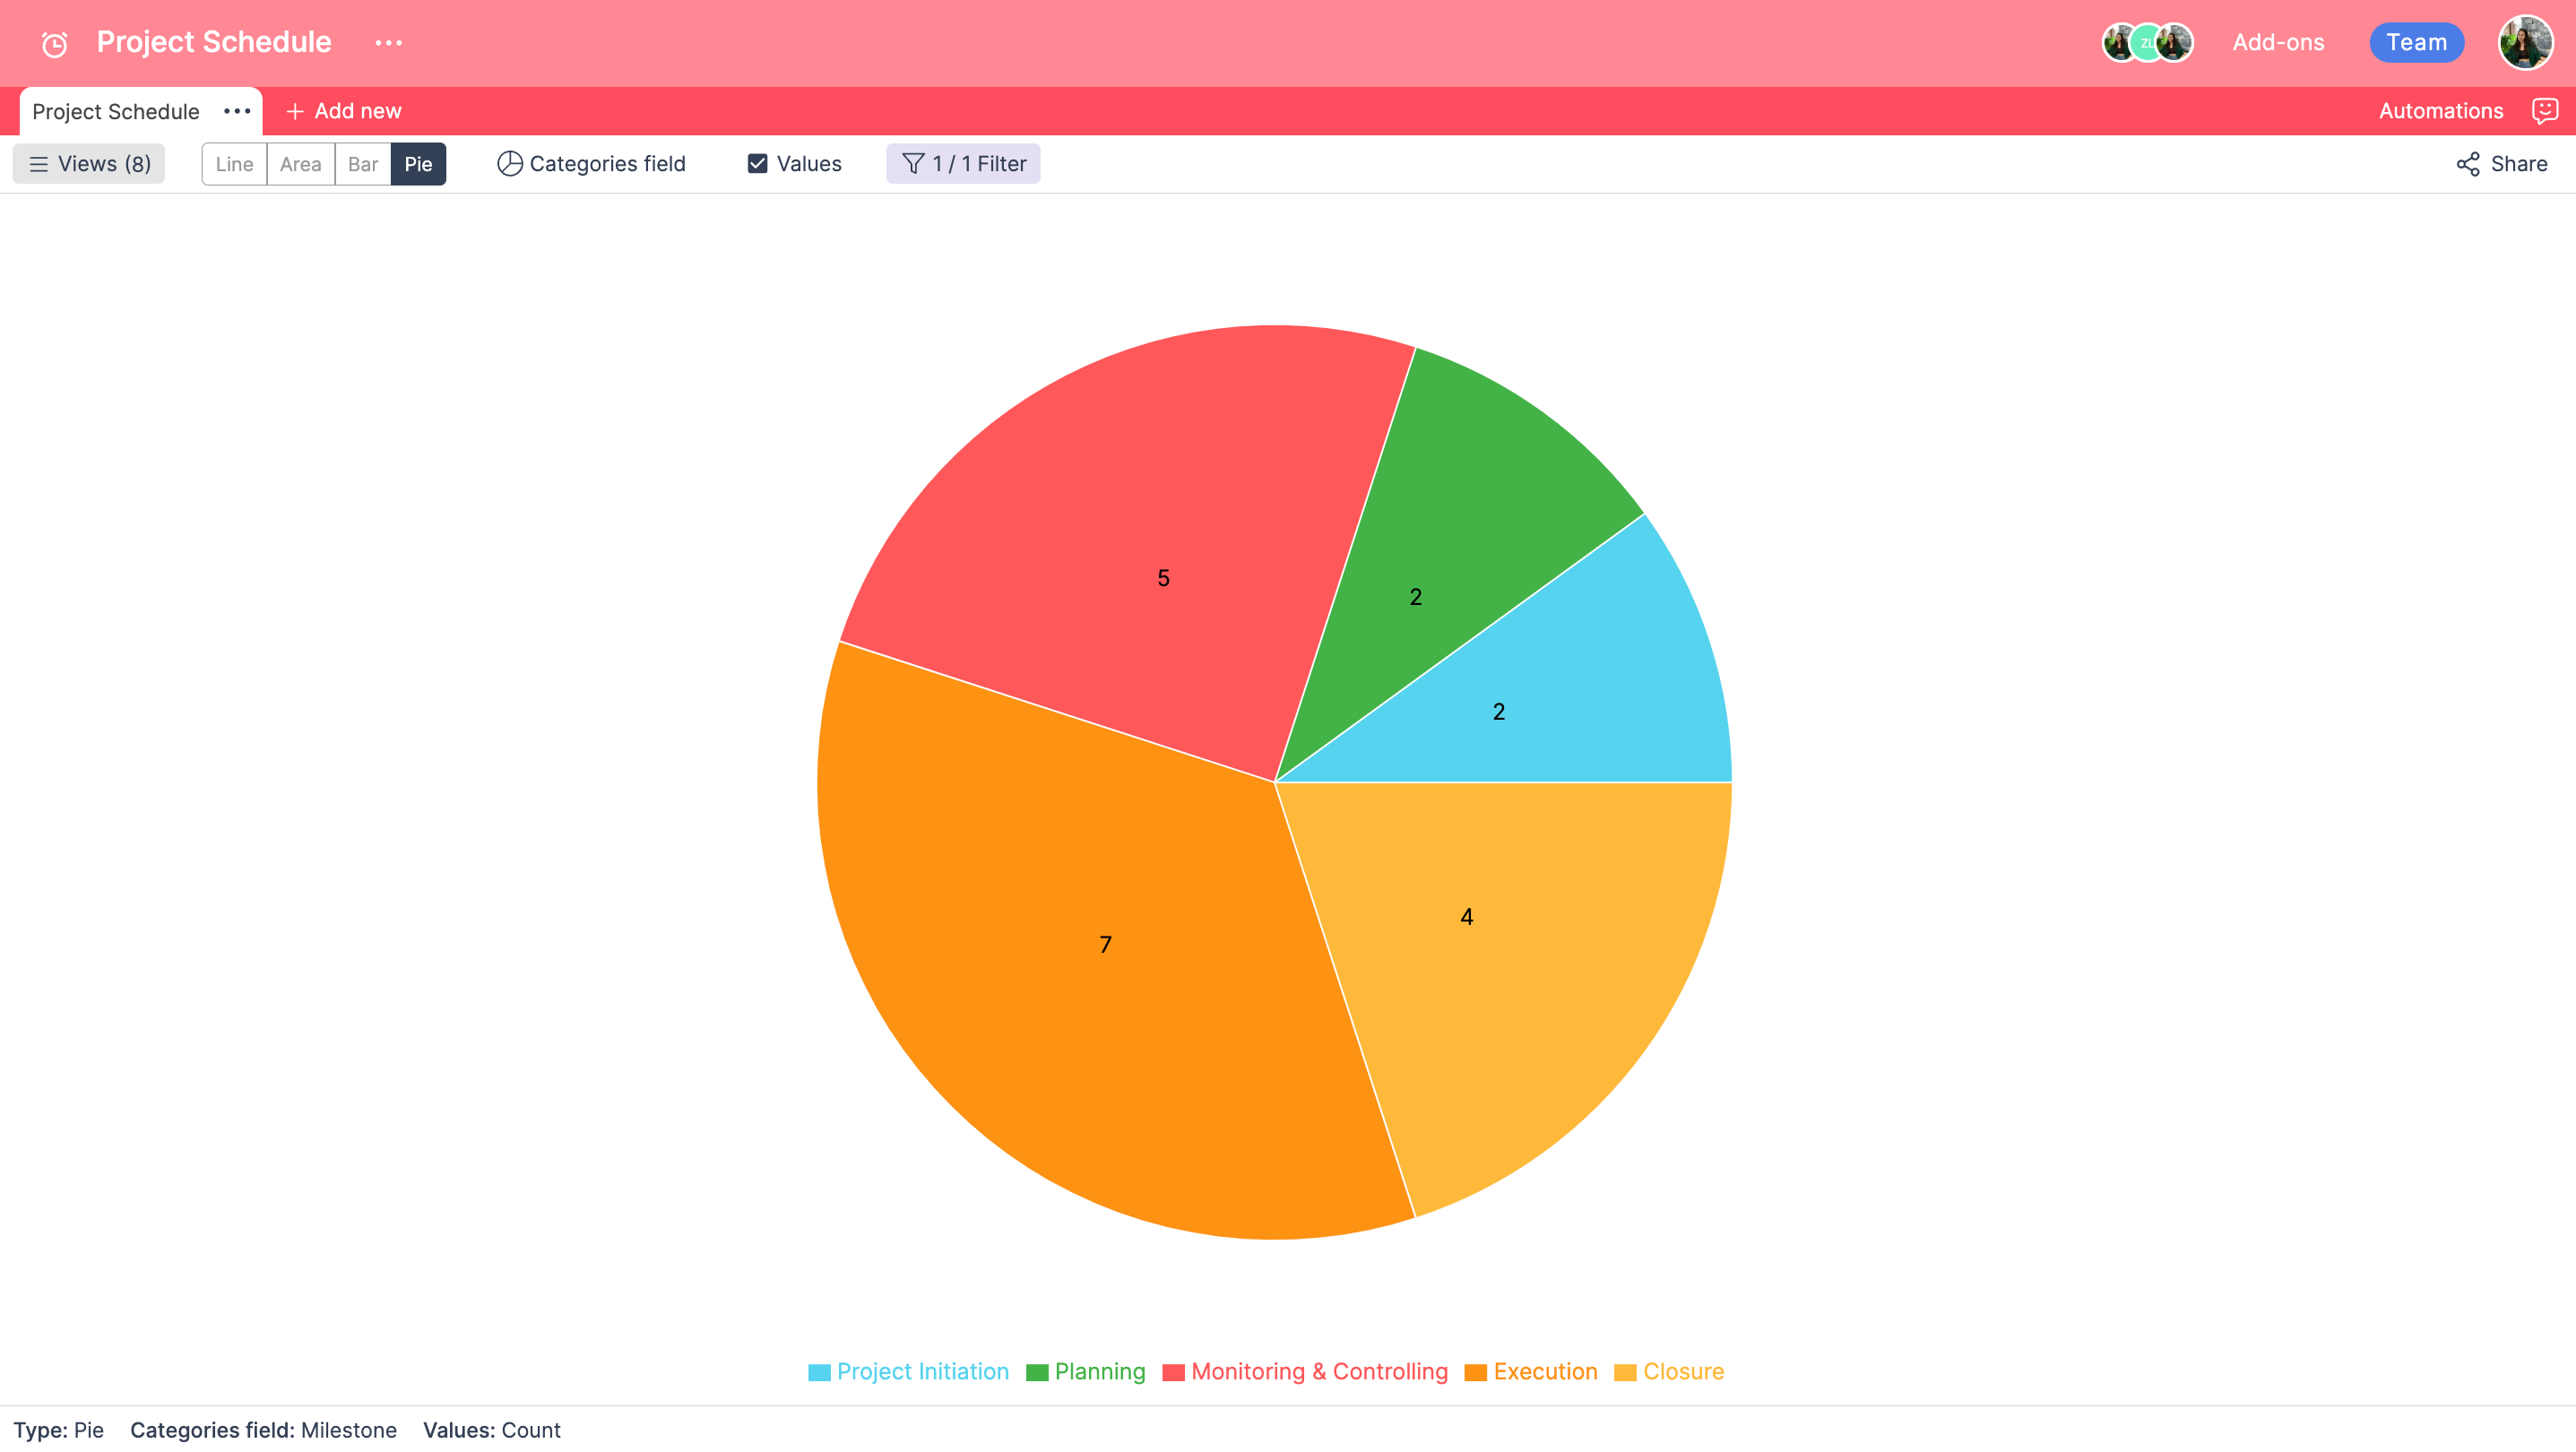
Pie charts are both useful in situations where you want to compare the relative proportions of a data set's constituent subsets. You can also filter your data in the chart view.
You can create a public view for your chart view like the other views. Your charts automatically synchronize dynamically whenever new data is added to your spreadsheet
Map view
Looking for a place around the world? Find it with the Map view!
Map View, displays all the locations selected in the Geolocation column type on the map and easily shows you the locations you selected in the Geolocation column type on the map. You can also view the details of these records by clicking on the pins on the map. Click any cell in your geolocation column and select a location or click the “find me” button to allow Retable to find your current location automatically. All your location records will show in your Map View.
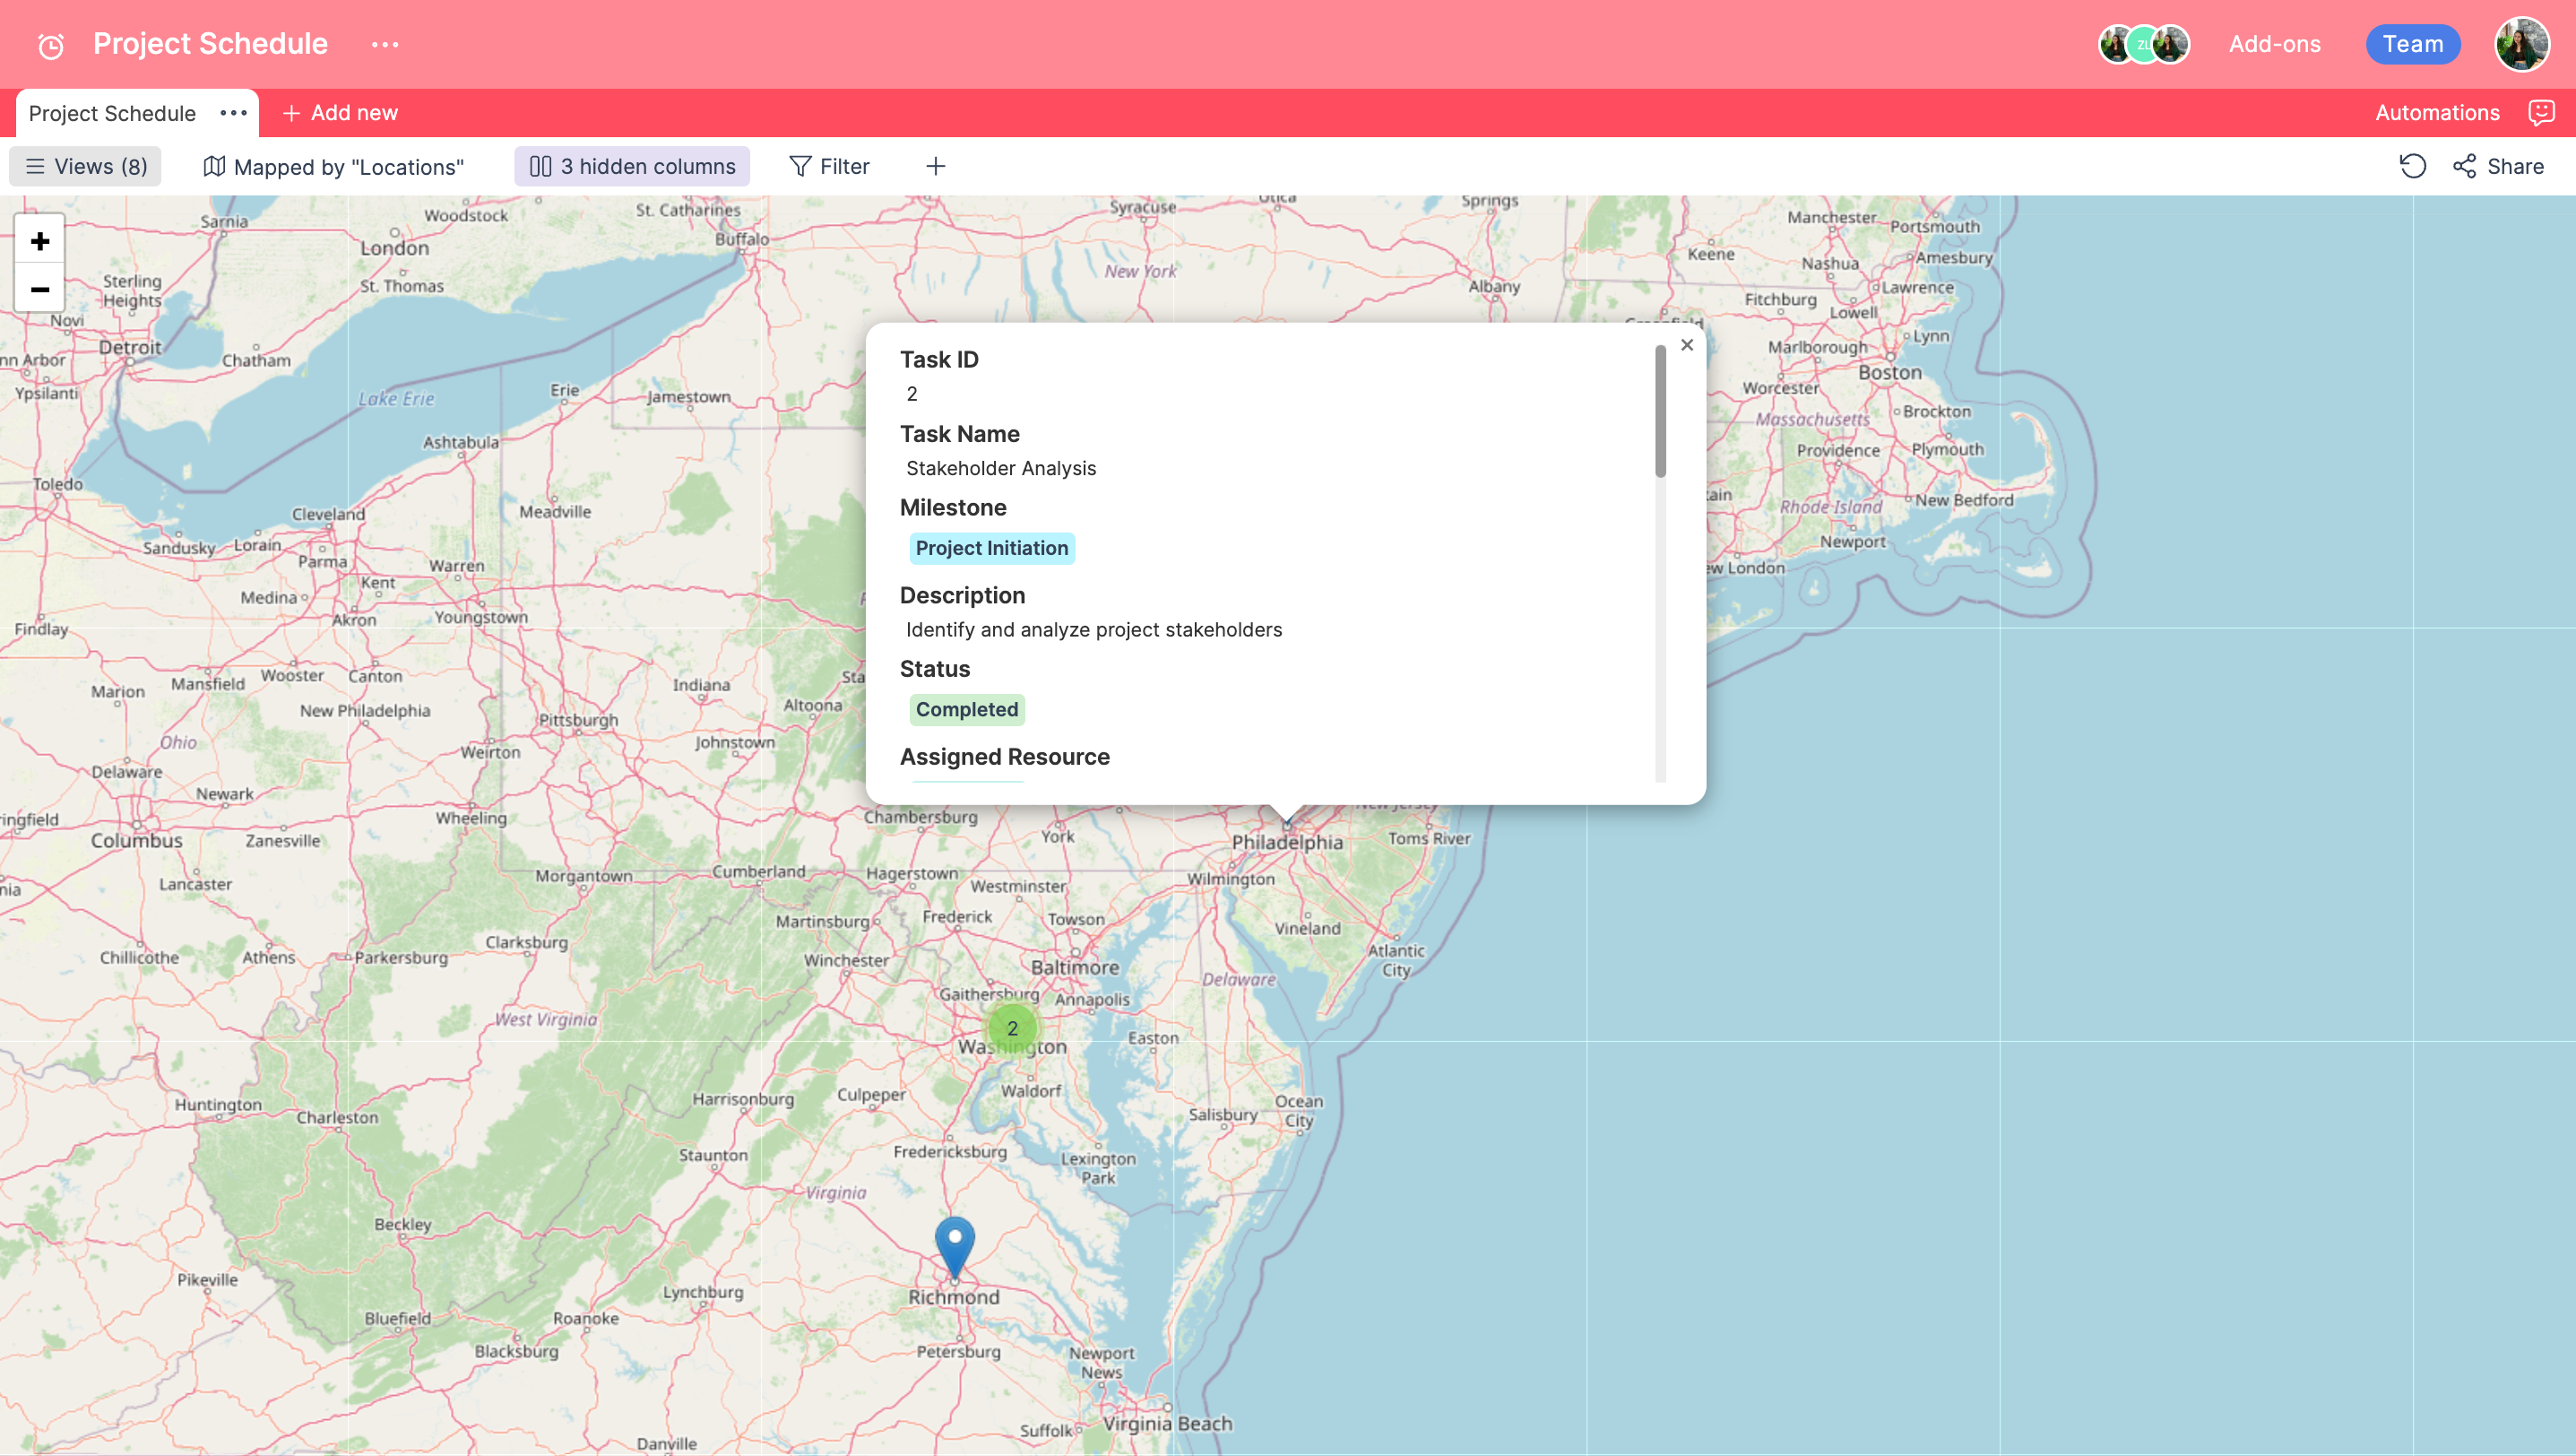
You can add new records to your table directly from the map by clicking the “+” icon. The records you add through the map are directly reflected in your table. You can continue to organize your records on the map. If you click on any pin on your map, the info cards will open. Click row detail so you can edit other columns or rows of your record. Same as always, you can undo, redo, or take snapshots from the arrow icon, and can create a public view for your map view like the other views.
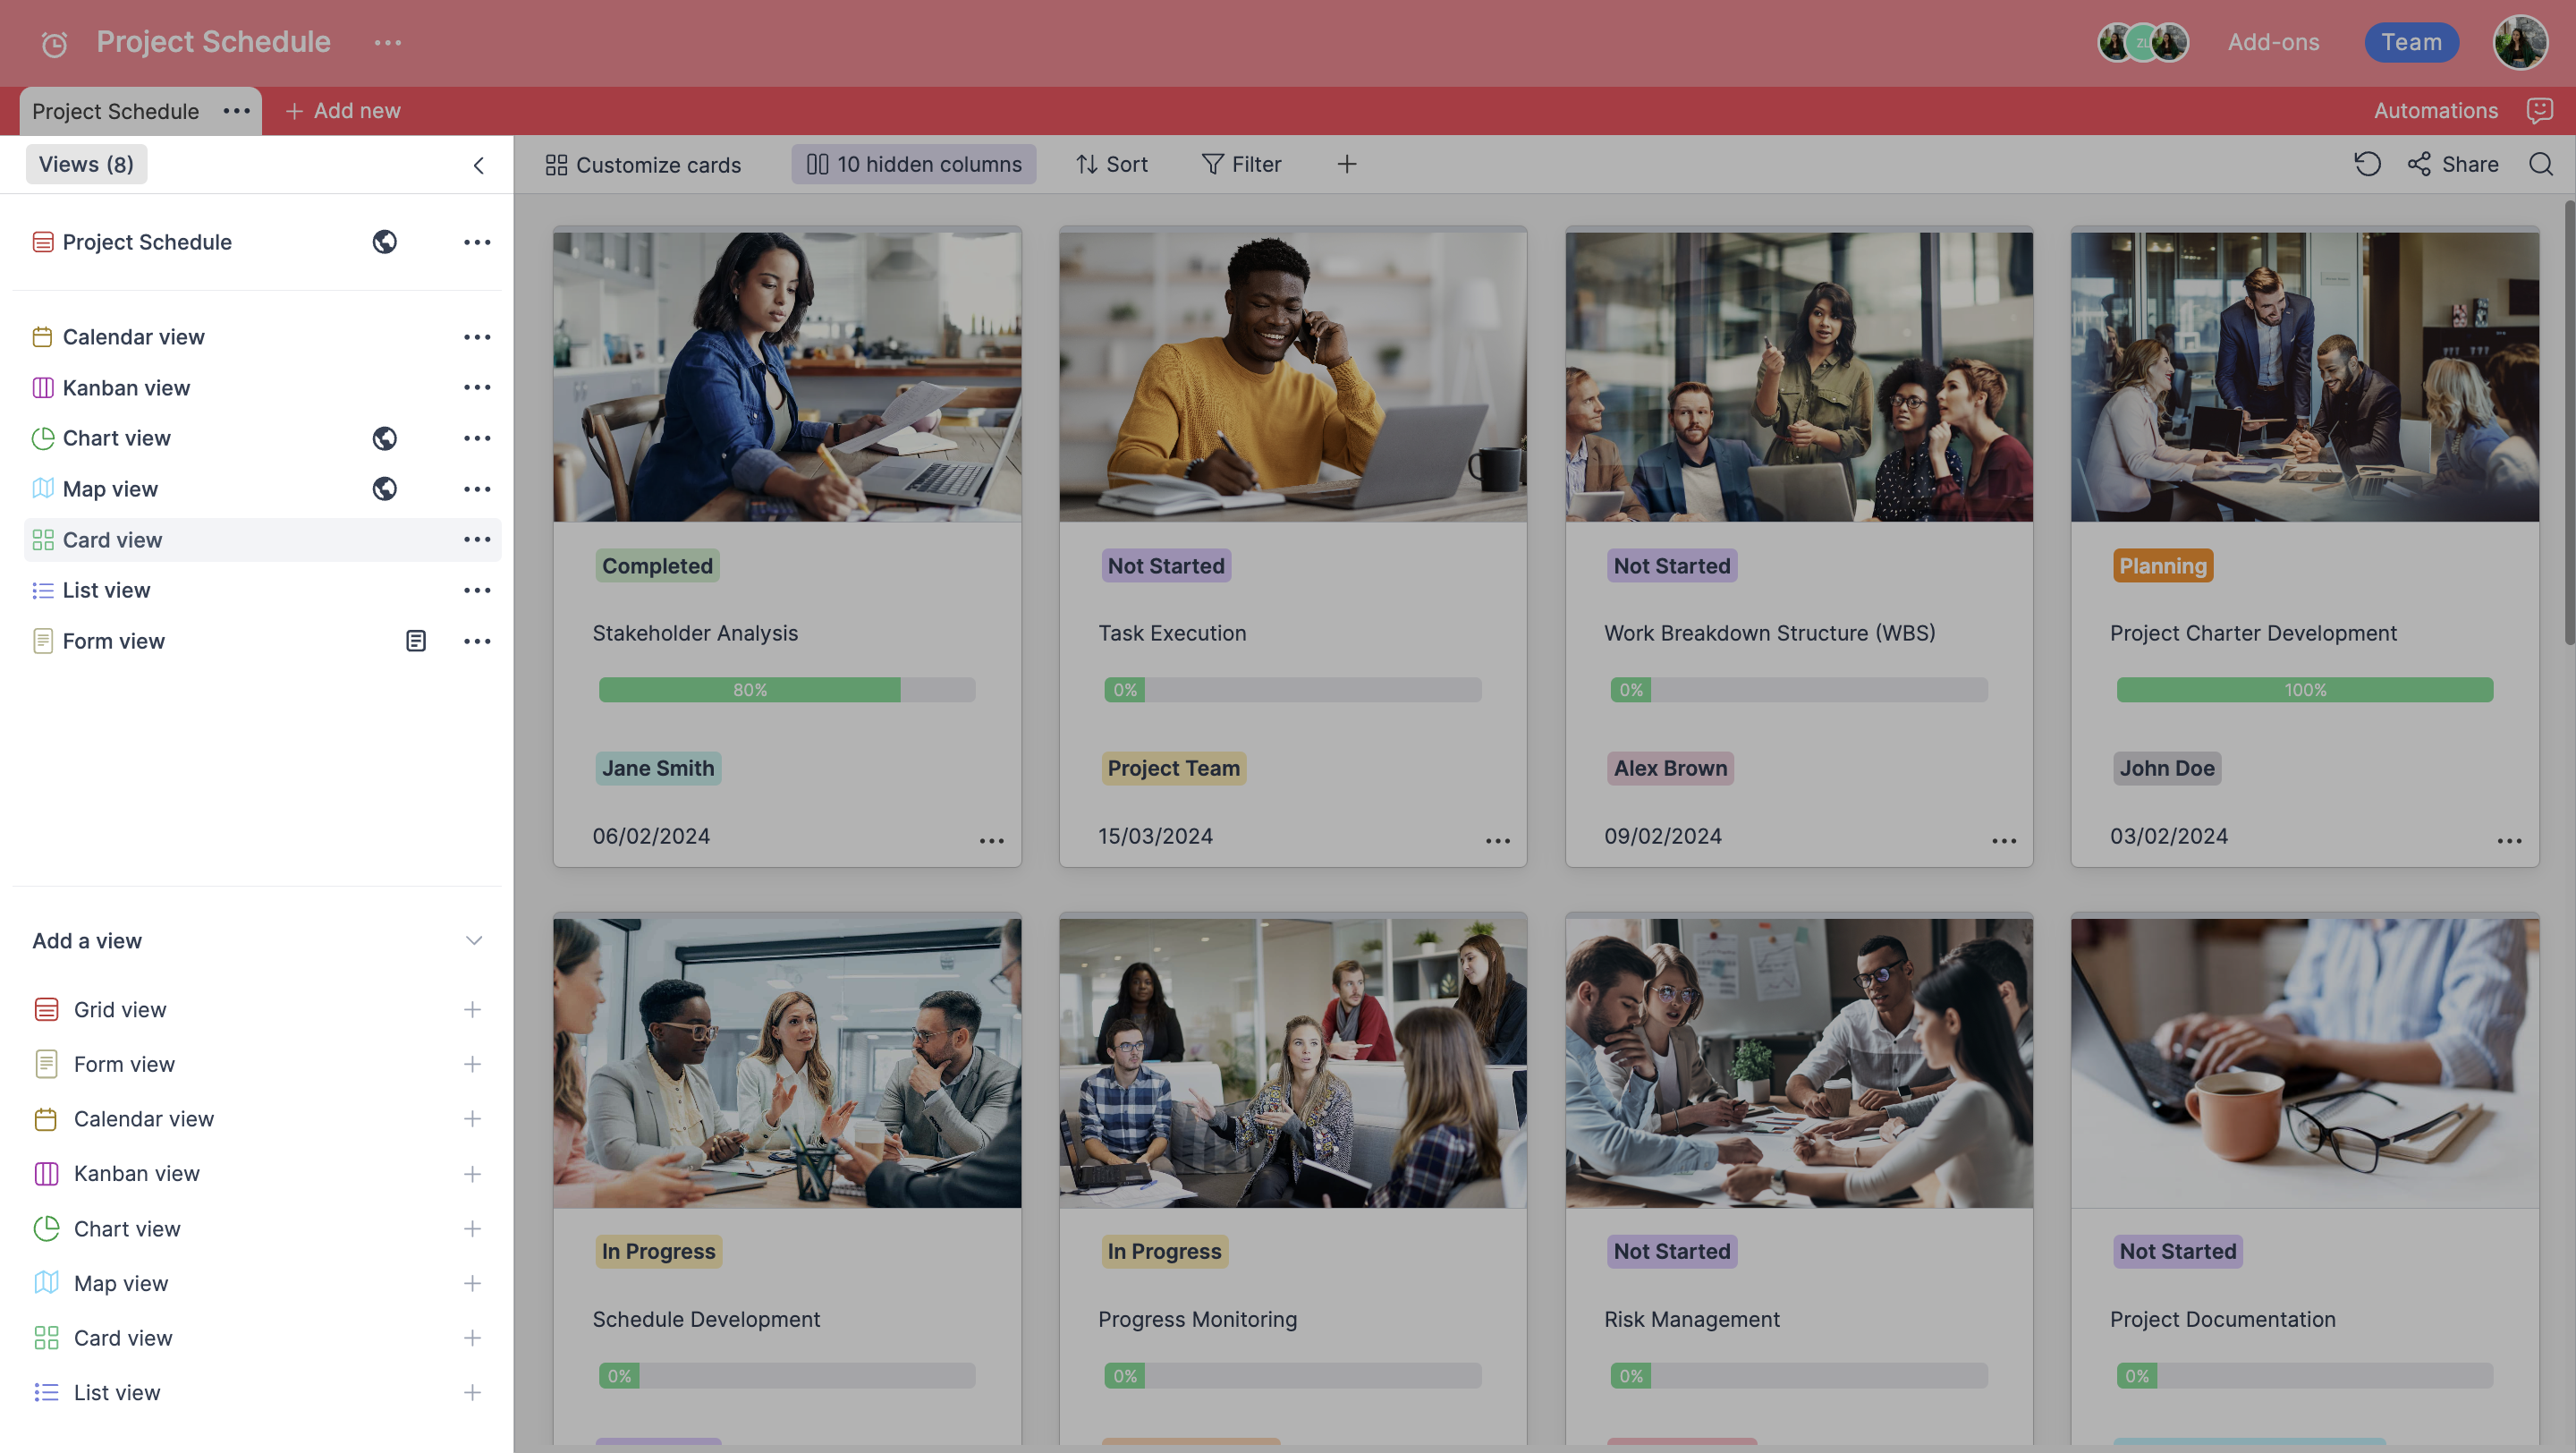
Card view
Card view is the ultimate solution for visually organizing your information like never before.
Retable's Card View allows you to seamlessly present your content in a clean and easily digestible format. Card View is the perfect solution for delivering a stunning user experience, whether you’re displaying products, articles, or contacts. Card view is a view in which each row is displayed in a card format. You can also stack the data in your QR, image, and color columns in the card view and view their previews. If there are cells with more than one image in your image column, all images are displayed as sliders on the relevant card.
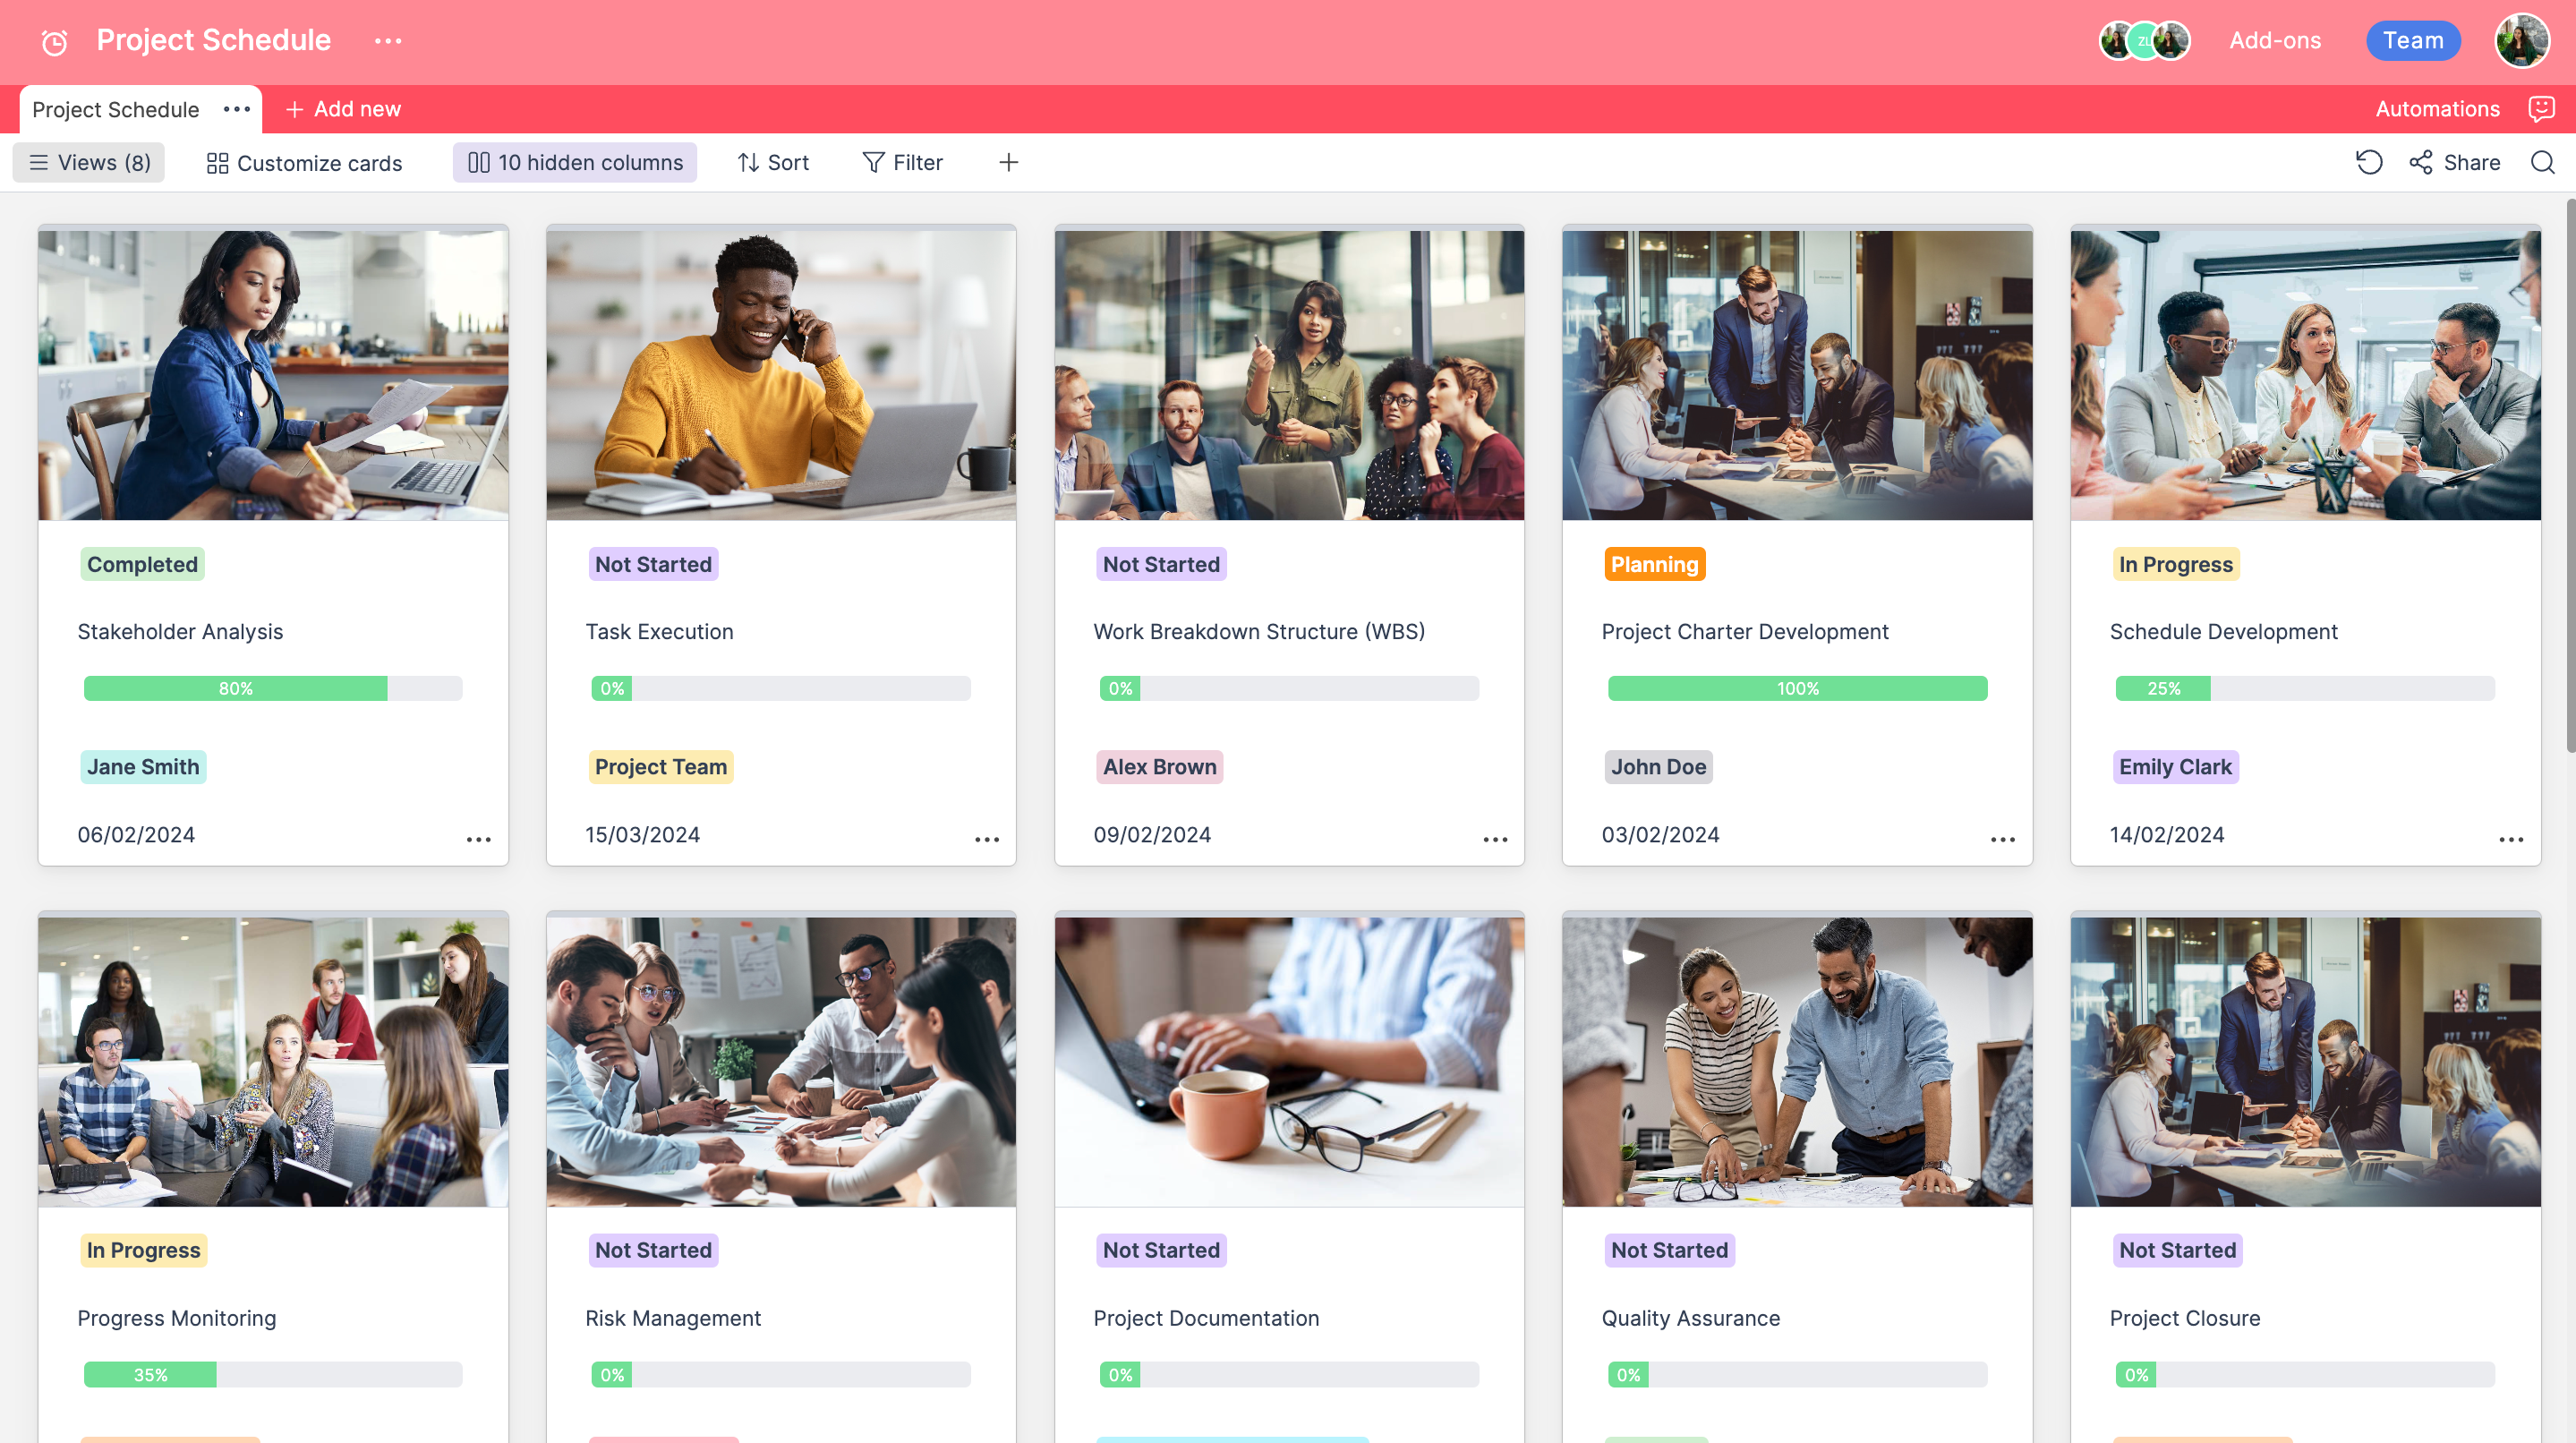
You can add an image column to see the uniqueness of the Card view. With this view, you can see the data you want to see, in an organized and visually appealing way. You can drag and drop each card, and edit the data you want to be seen by clicking on the buttons of each column. If you click on any record in your card, the item detail field will open, so you can edit other columns or rows of your record.
List view
Last but not least, let’s look at the List view. This is a special type of view that represents your records as rows in a list. List view shows the data in each row along with the column name information.
This view is very effective, especially for mobile use. Therefore, you do not have to go back to the beginning of the table to find which cell is in which column; the name of the column is also written at the beginning of the relevant cell in each row. You can drag and drop your rows, sort and filter your data all in one view. If you click any data in the list view the row detail area will be open and you can change your row details from this area.
With Retable’s diverse view options, from Grid to Map and Kanban to Chart, managing your data has never been easier or more visually captivating. These views are designed to make your data work for you most efficiently and engagingly possible. Explore the views and endless possibilities with Retable, and transform the way you interact with your data.
more
Related Resources


Create your smart data management solution
Plan, track, and analyse with your ease. Transform your data with an all-in-one platform, collaborate with your teammates.
Try for free!