.avif)
.avif)
Retable is a powerful tool for converting spreadsheets into organized and easily accessible databases. By using Retable's expertise in database management systems, data modeling, and data integration, businesses can import their data, create tables, establish relationships, add indices, create different data views, share the data with their teammates and control the permission, track all history, and quick reporting. Additionally, Retable's ability to provide robust data backup solutions ensures that businesses' data is protected and can be easily recovered in case of an emergency. By working with Retable, businesses can streamline their data management process, make it easier to find the information they need, and make better decisions.
What is Spreadsheet
A spreadsheet is a type of computer software that is used to organize, store, and manipulate data in a grid-like format. It typically consists of rows and columns, with each cell in the grid able to hold a single piece of data. Spreadsheets are used for a variety of purposes, such as budgeting, financial analysis, and data management. The most common type of spreadsheet software is Microsoft Excel, but there are also many other options available, such as Google Sheets,Apple Numbers and Retable. Spreadsheets are commonly used in business, finance, and accounting, but they can also be used for personal projects such as creating a budget or tracking expenses. They provide an easy way to input, organize, and analyze data, and they allow you to create charts, graphs, and other visualizations to help you understand your data better.
What is Database
A database is a collection of data that is organized in a specific way, allowing for efficient storage, retrieval, and management of information. It is typically made up of tables, which are organized into rows and columns, similar to a spreadsheet. However, unlike spreadsheets, databases are designed to handle large amounts of data and support advanced features such as data validation, relationships, indexes, and transactions.
There are different types of databases such as:
- Relational databases: stores data in tables with rows and columns, and allows for the creation of relationships between tables
- Document databases: stores data in documents, such as JSON or XML, which can contain fields and nested fields
- Graph databases: stores data in nodes and edges and allows for the creation of relationships between nodes
Databases are used in a wide range of applications, such as e-commerce websites, financial systems, and social media platforms, to store and manage large amounts of data. They are often used to support business operations, decision making, and analytics.
Differences Between Spreadsheet and Database
There are several key differences between spreadsheets and databases:
- Data organization: Spreadsheets organize data in a grid-like format, with rows and columns, while databases organize data in tables, with rows and columns.
- Data size: Spreadsheets are typically designed to handle smaller amounts of data, while databases can handle much larger amounts of data.
- Data manipulation: Spreadsheets are primarily used for data entry and analysis, while databases are designed for more advanced data manipulation and management, such as data validation, relationships, indexes, and transactions.
- Data security: Spreadsheets typically have limited built-in security features, while databases have more advanced security features such as user authentication and access control.
- Data sharing: Spreadsheets are typically used for individual or small group projects, while databases are often used for larger projects and can support multiple users working with the same data simultaneously.
- Data backup: Spreadsheets are typically backed up manually, while databases have built-in backup and recovery features.
- Data types: Spreadsheets are mainly used to store structured data, while databases can handle structured, semi-structured, and unstructured data.
- Query language: Spreadsheets use formulas and functions to query data, while databases use SQL (Structured Query Language) to query data.
Database or Spreadsheet? Which Should You Prefer?
The choice between using a database or a spreadsheet will depend on the specific needs of your project. Here are some factors to consider when making your decision:
- Data size: If you have a large amount of data that needs to be stored and managed, a database is likely to be a better choice.
- Data manipulation: If you need advanced data manipulation and management features, such as data validation, relationships, indexes, and transactions, a database is the better choice.
- Data security: If data security is a concern, a database is likely to be a better choice, as it typically has more advanced security features such as user authentication and access control.
- Data sharing: If multiple users need to work with the same data simultaneously, a database is likely to be a better choice.
- Data backup: If you need automatic backup and recovery features, a database is the better choice.
- Data types: If your data is unstructured, semi-structured or you need to handle non-tabular data, a database is the better choice.
- Query language: If you need advanced querying capabilities, a database is likely to be a better choice, as it uses SQL (Structured Query Language) to query data.
- Budget: If you have a limited budget or if you're working on a small project, a spreadsheet may be a more affordable option.
Ultimately, the choice between a database or a spreadsheet will depend on the specific needs of your project, the size and complexity of your data, and the resources available to you.
How to Combine the Power of Databases and the Flexibility of Spreadsheets?
There are several ways to combine the power of databases and the flexibility of spreadsheets:
- Use a database as a data source: Many spreadsheet software, such as Retable, allow you to connect to and import data from a variety of databases. This allows you to take advantage of the advanced data manipulation and management capabilities of the database while still being able to use the spreadsheet software to analyze and visualize the data.
- Use a spreadsheet to import data into a database: Some database management systems, such as MySQL, allow you to import data from a spreadsheet into a new or existing table in the database. This can be useful when you have a large amount of data in a spreadsheet that you want to convert into a database.
- Use a middleware: A middleware is a software layer that sits between the database and the spreadsheet, allowing you to connect and transfer data between them. This allows you to take advantage of the advanced data manipulation and management capabilities of the database while still being able to use the spreadsheet software to analyze and visualize the data.
- Use a BI tool: A Business Intelligence (BI) tool can connect to multiple databases and spreadsheets, allows you to combine and analyze the data, and create visualizations.
By combining the power of databases and the flexibility of spreadsheets, you can take advantage of the best of both worlds and make the most of your data.
Where to Start to Convert Spreadsheets to Databases?
To convert spreadsheets to databases, the first step is to gather all of the spreadsheets you want to convert into a single location. This will make it easier to import the data into your new database. Then, you should review the spreadsheets and make sure that they are up to date and in the same format. Once your spreadsheets are organized and ready, you will need to choose a database management system (DBMS) that you will use to create your database. Once you have chosen a database management system, you can import your data into the new system and start creating tables, establishing relationships, and setting up indices. You may also want to consider creating different data views, sharing your data with teammates, tracking all history and quick reporting. Finally, it is important to have a robust data backup strategy in place to ensure that your data is protected and can be easily recovered in case of an emergency.
How Retable Combines the Power of Databases with the Flexibility of Spreadsheets
Retable combines the power of databases with the flexibility of spreadsheets in several ways:
- Retable allows you to import data from a variety of sources, including spreadsheets, and store it in a centralized database.
- Retable allows you to create different data views, which can be used to make the data more accessible and easy to understand.
- Retable's data modeling feature allows you to create relationships between tables, which can be used to create complex queries and reports.
- Retable's built-in reporting and visualization tools allow you to analyze your data and create charts and graphs, similar to a spreadsheet.
- Retable's user-friendly interface allows you to easily search and filter your data, making it easy to find the information you need.
- Retable's data backup feature allows you to automatic backups and recover your data in case of an emergency.
- Retable's user access control feature allows you to share your data with your teammates and control the permission level.
By combining the power of databases with the flexibility of spreadsheets, Retable helps you make the most of your data, streamline your data management process, and make better decisions.
How to Use Retable to Convert Spreadsheets to Databases?
- Gather your data in one place
- Create tables
- Establish relationships between tables
- Create different data views
- Share your data with your teammates and control permissions
- Track all history
- Creating quick reports
- Backup Your Data
Gather your data in one place
Retable is a platform that allows you to organize all of your data in one place by using workspace structure. Here are the steps to gather your spreadsheets in one place with Retable:
- Log in to your Retable account.
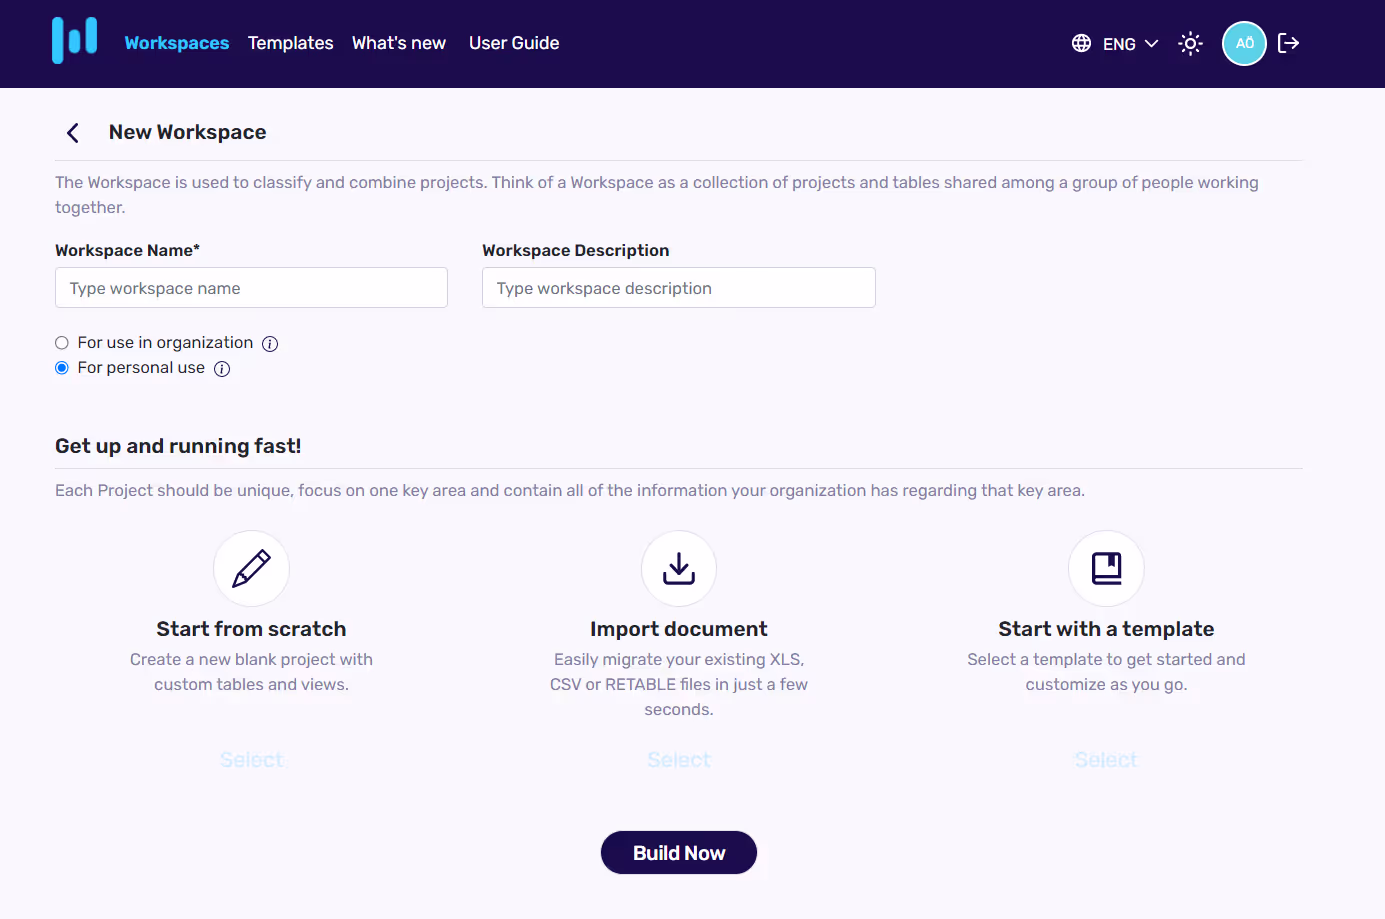
- Click on the "Add Workspace" button on the left menu.
- Give a name to the new workspace and select your project creation preference between 3 options.
- If you want to start with a blank spreadsheet select "Start from scratch".
- If you want to start with an existing XLS or CSV document select "Import document"
- If you want to start with a template select "Start with a template"
- After made your selection click on "Build" button.
- Then you'll automatically redirected to your Retable Dashboard and see your new project.
- If you want to add more project under your workspace click on the "Add Project" button.
- You can make your project creation preferences and add a new project under the existing workspace
- Then, you'll automatically redirected to your Retable Dashboard and see your new project.
- Now, Click on the new created project. If you created your project by selecting start from scratch you can also import a document in your project
- Click on the 3 dots icon directly near your table name and select "Import" button.
- Select the XLS or CSV file from your device. If you activate the "Insert" toggle you can directly import an existing XLS or CSV document into Retable. If you activate the "Replace" toggle all your data in this table is replaced with the data you imported. If you do not have any data in your Retable table you can start by activating the "Insert" toggle. If you tick the "First row is header" your first row in the imported document will be your column names in your Retable Spreadsheet.
- Now, you can click on the "Upload" button.
- You can repeat this process to import additional spreadsheets.
- Once all of your spreadsheets are imported into Retable, you can create tables, establish relationships, and set up indices. You may also want to consider creating different data views, sharing your data with teammates, tracking all history and quick reporting.
Create tables
Retable allows you to easily create tables from the data you have imported into your workspaces or by starting from scratch. Here are the steps to create tables with Retable:
- Log in to your Retable account
- Select the appropriate workspace from the list of workspaces
- Select the appropriate project from the list of projects
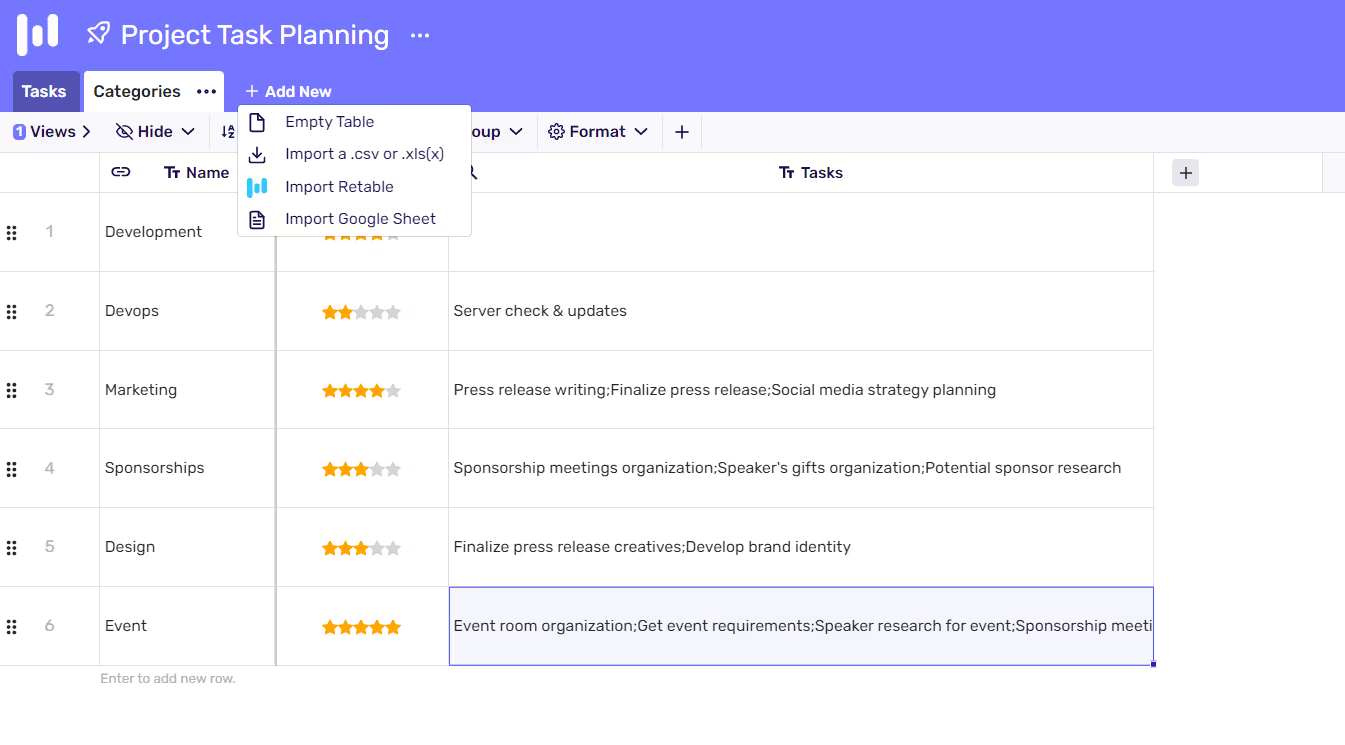
- Click on the "Add New" button on the top bar
- Select one between the options "Empty Table, import XLS or CSV, import Retable, import Google Sheet"
- Give a name to the table by clicking on the 3 dots and select "Rename table"
- Retable will automatically create the table and display it in the tables section.
- You can now start adding, editing, and deleting data in the table.
- You can also establish relationships between tables, set up indices, and create different data views.
By creating tables with Retable, you can easily organize, store, and manipulate your data and take full advantage of Retable's advanced data management features.
Establish relationships between tables
Retable allows you to easily establish relationships between tables, which can be used to create complex queries and reports. Here are the steps to establish relationships between tables with Retable:
- Log in to your Retable account
- Select the appropriate workspace from the list of workspaces
- Select the appropriate project from the list of projects
- Select a table on the tables section on the top menu
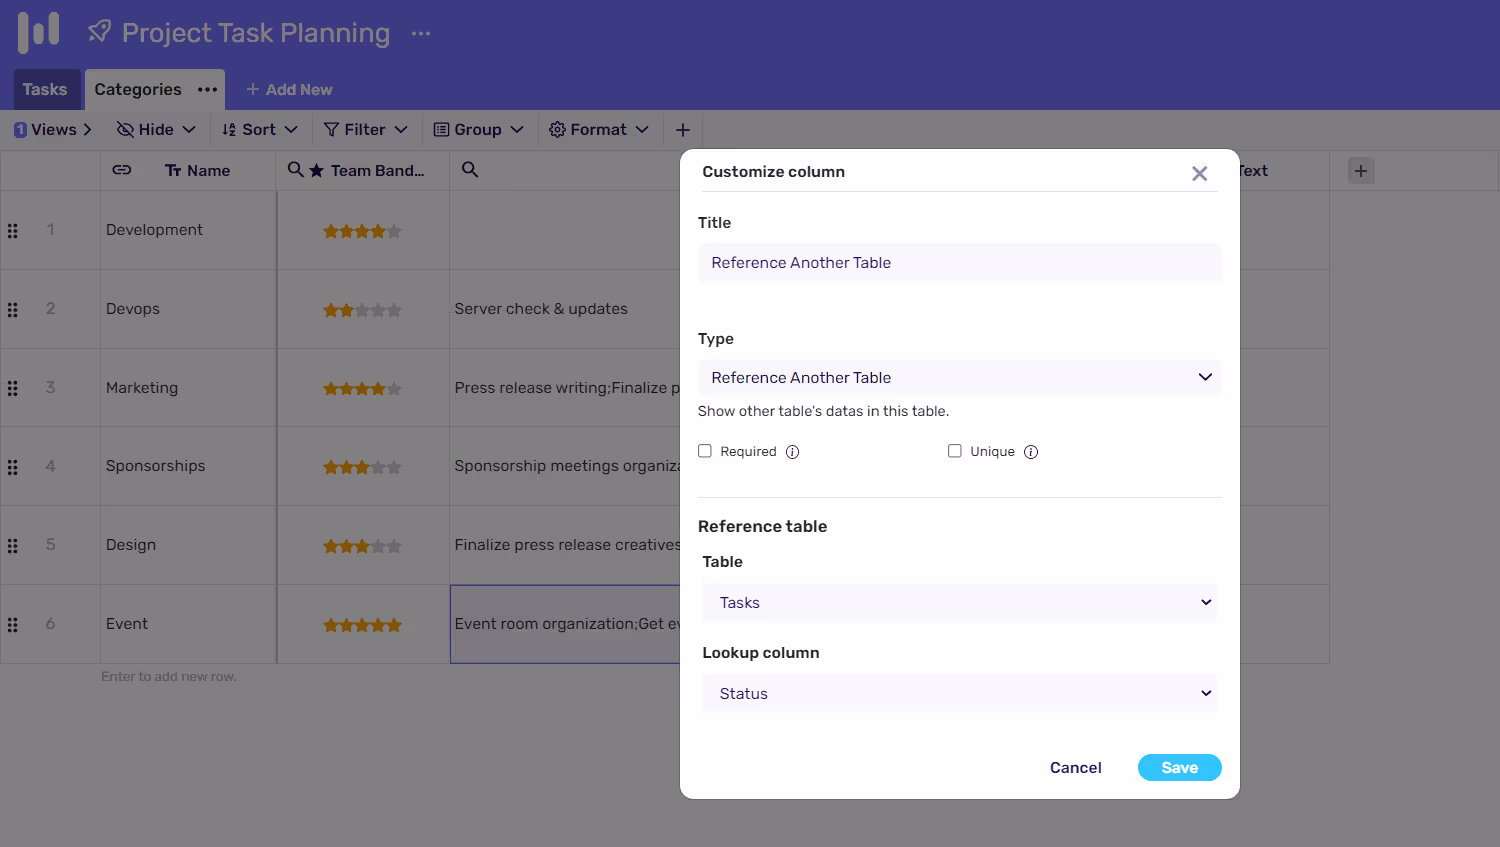
- Add a "Reference Another Table" column
- Select the table that you want to create a relationship between
- Select the columns that you want to use to establish the relationship
- Click on "Save" button
- Retable will automatically create the relationship between the tables, and you can now start querying the data using the relationship
- Add a new column if you want to get more reference data from the table you have established a relationship with. Select the "Lookup Values" column type
- Select the table that you want to create a relationship between
- Select the columns that you want to use to establish the relationship
Create different data views
Retable allows you to easily create different data views as calendar, kanban, chart list or grid, which can be used to make the data more accessible and easy to understand. Here are the steps to create different data views with Retable:
- Log in to your Retable account
- Select the appropriate workspace from the list of workspaces
- Select the appropriate project from the list of projects
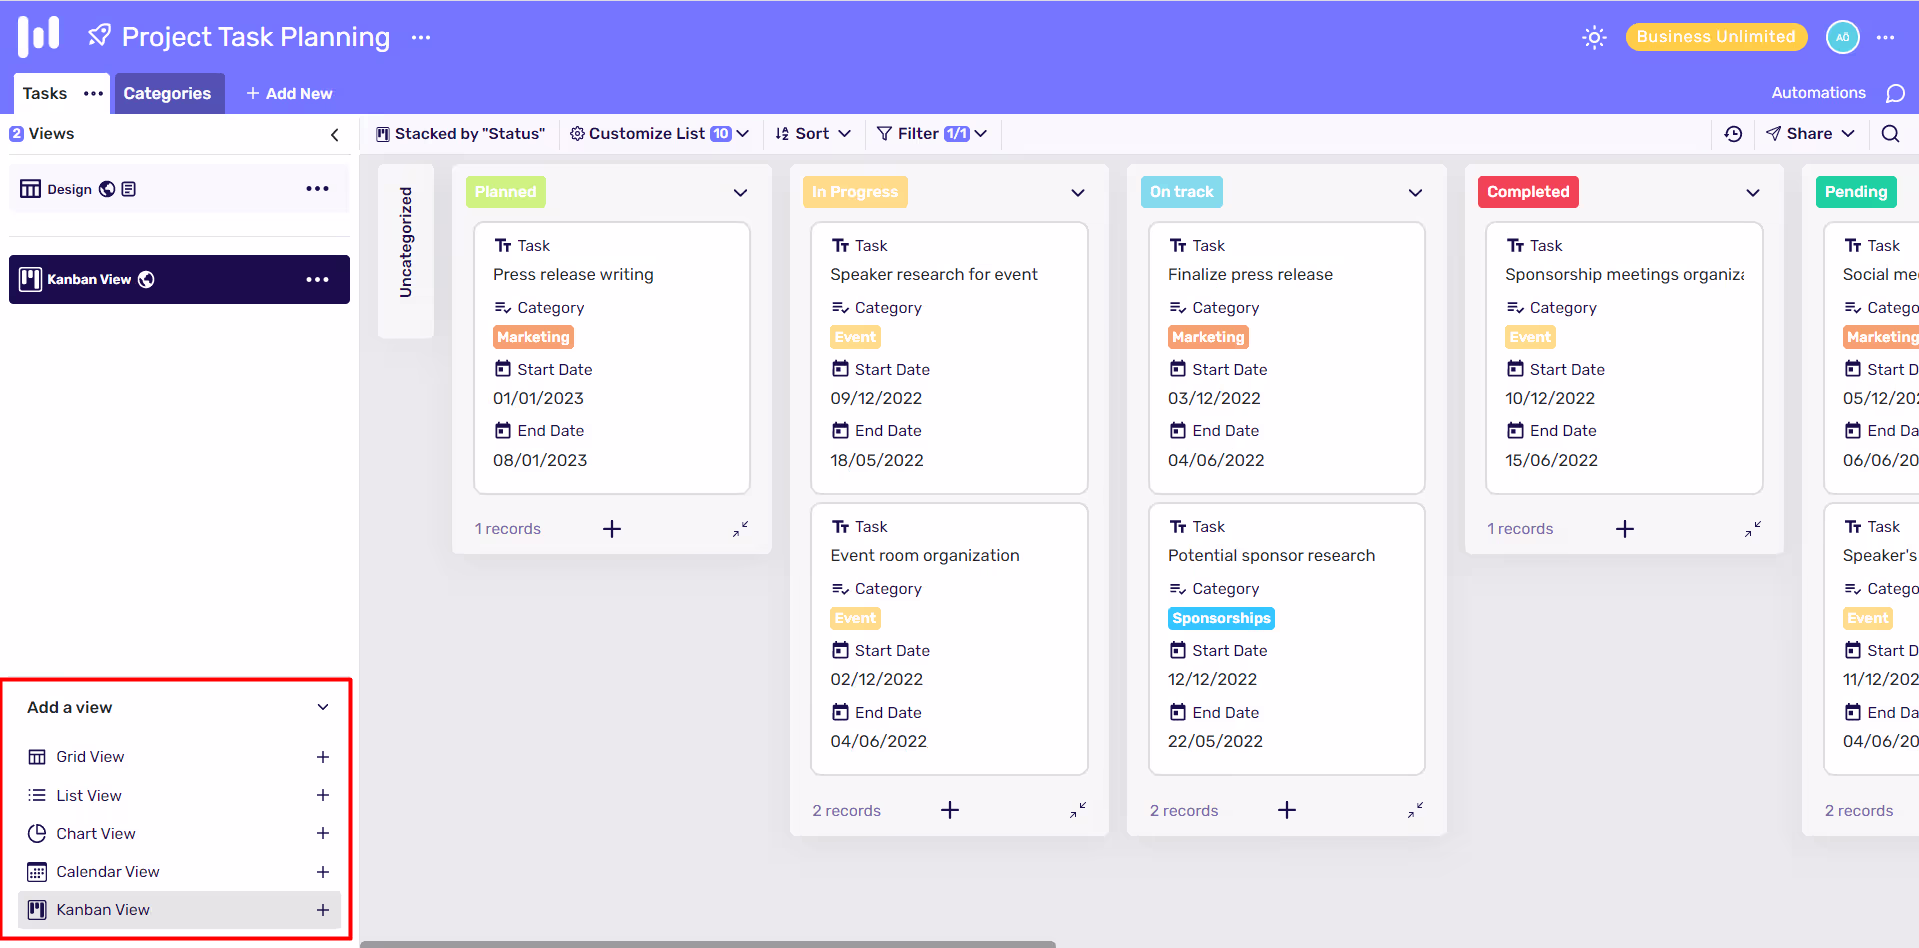
- Click on the "Views" section on the left menu
- Select a view from the "Add a View" section
- You can also apply filters, sorting and grouping on the view
- You can give a name to your new view by clicking the 3 dots near the view name
- Retable will automatically create the view, and it will be added to the list of views.
- You can now start browsing the data in the view, and it will be easier to understand and analyze.
- You can also share the views with your teammates, and they can also access the data in the view.
By creating different data views with Retable, you can easily organize, store, and manipulate your data and make it more accessible and easy to understand. It allows you to see the data from different perspectives, and it can help you make better decisions.
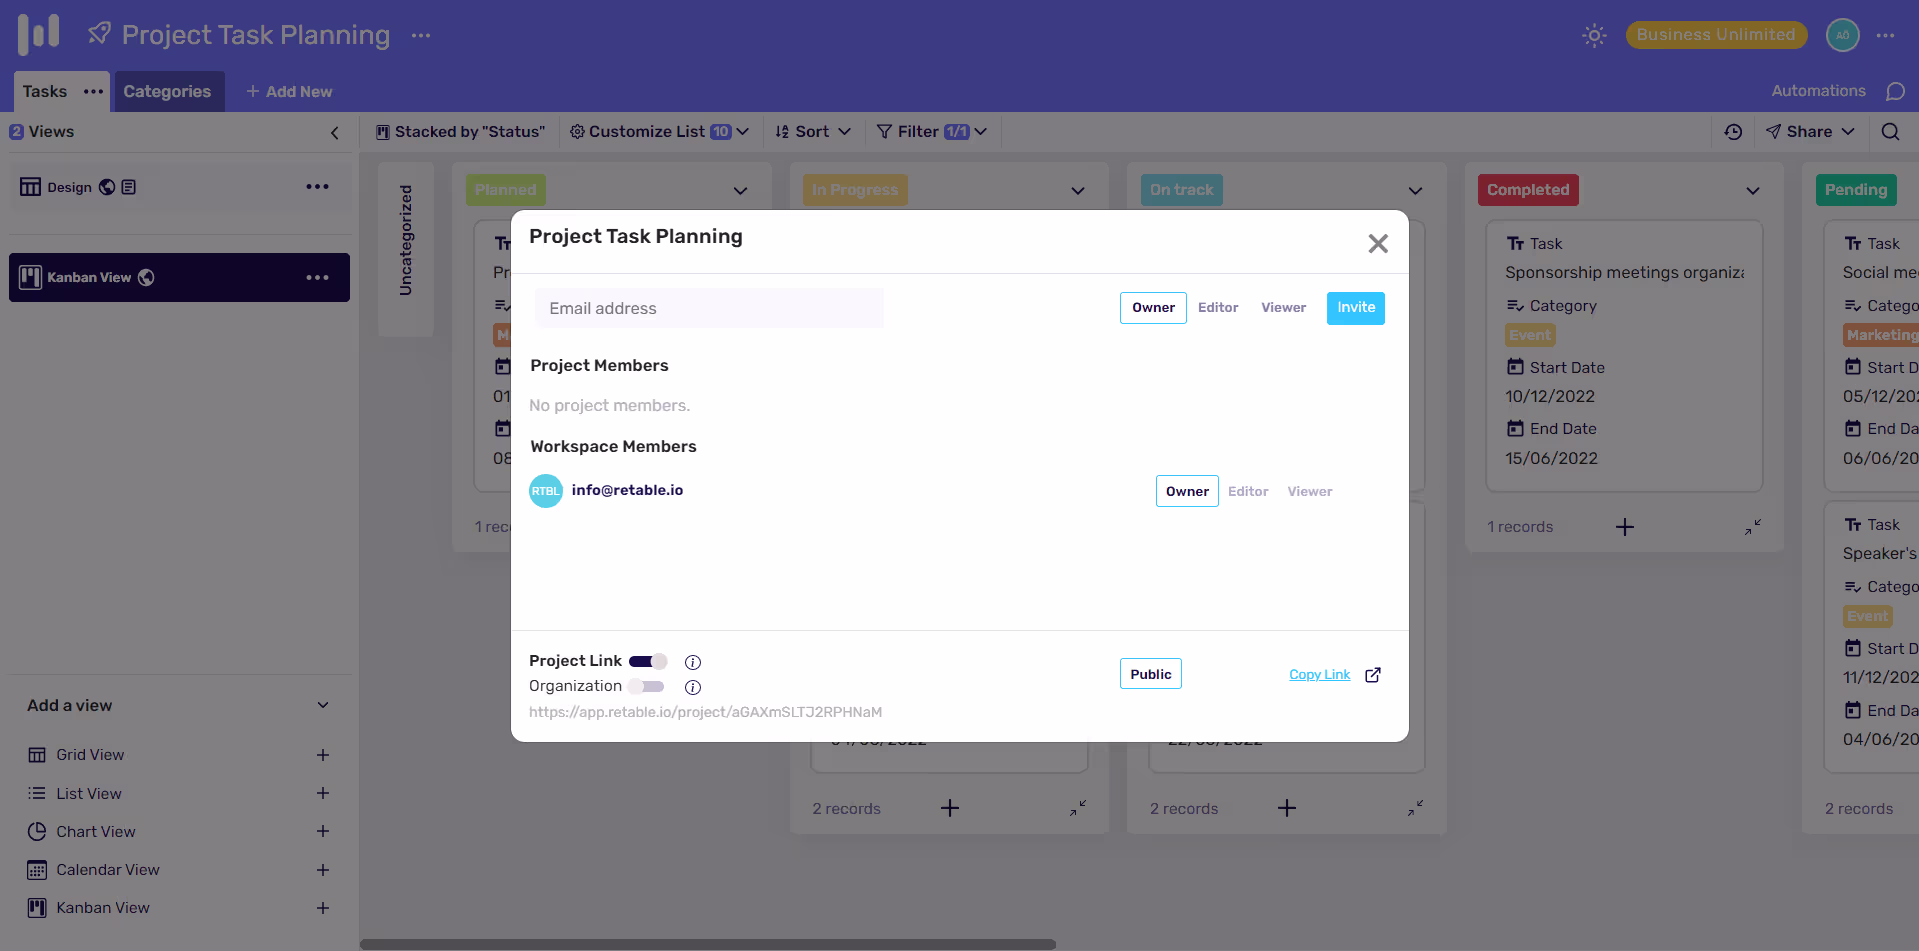
Share your data with your teammates and control permissions
Retable allows you to easily share your data with your teammates and control the permissions. Here are the steps to share your data with your teammates and control permissions:
- Log in to your Retable account
- Select the appropriate workspace from the list of workspaces
- Select the appropriate project from the list of projects
- Go to the "Project Settings" by clicking the 3 dots near the project name
- Click on the "Invite Collaborators"
- Invite teammates by adding their email address
- Assign roles to your teammates (e.g. Owner, Editor, Viewer)
- Click on "Invite" button
- Your teammates will receive an email with an invitation to join the project and will have access to the data according to the permission level assigned to their role
By sharing your data with your teammates and controlling permissions, you can easily collaborate with your team and ensure that the data is being used appropriately. You can also restrict access to sensitive data, and it can help you maintain data security and integrity.
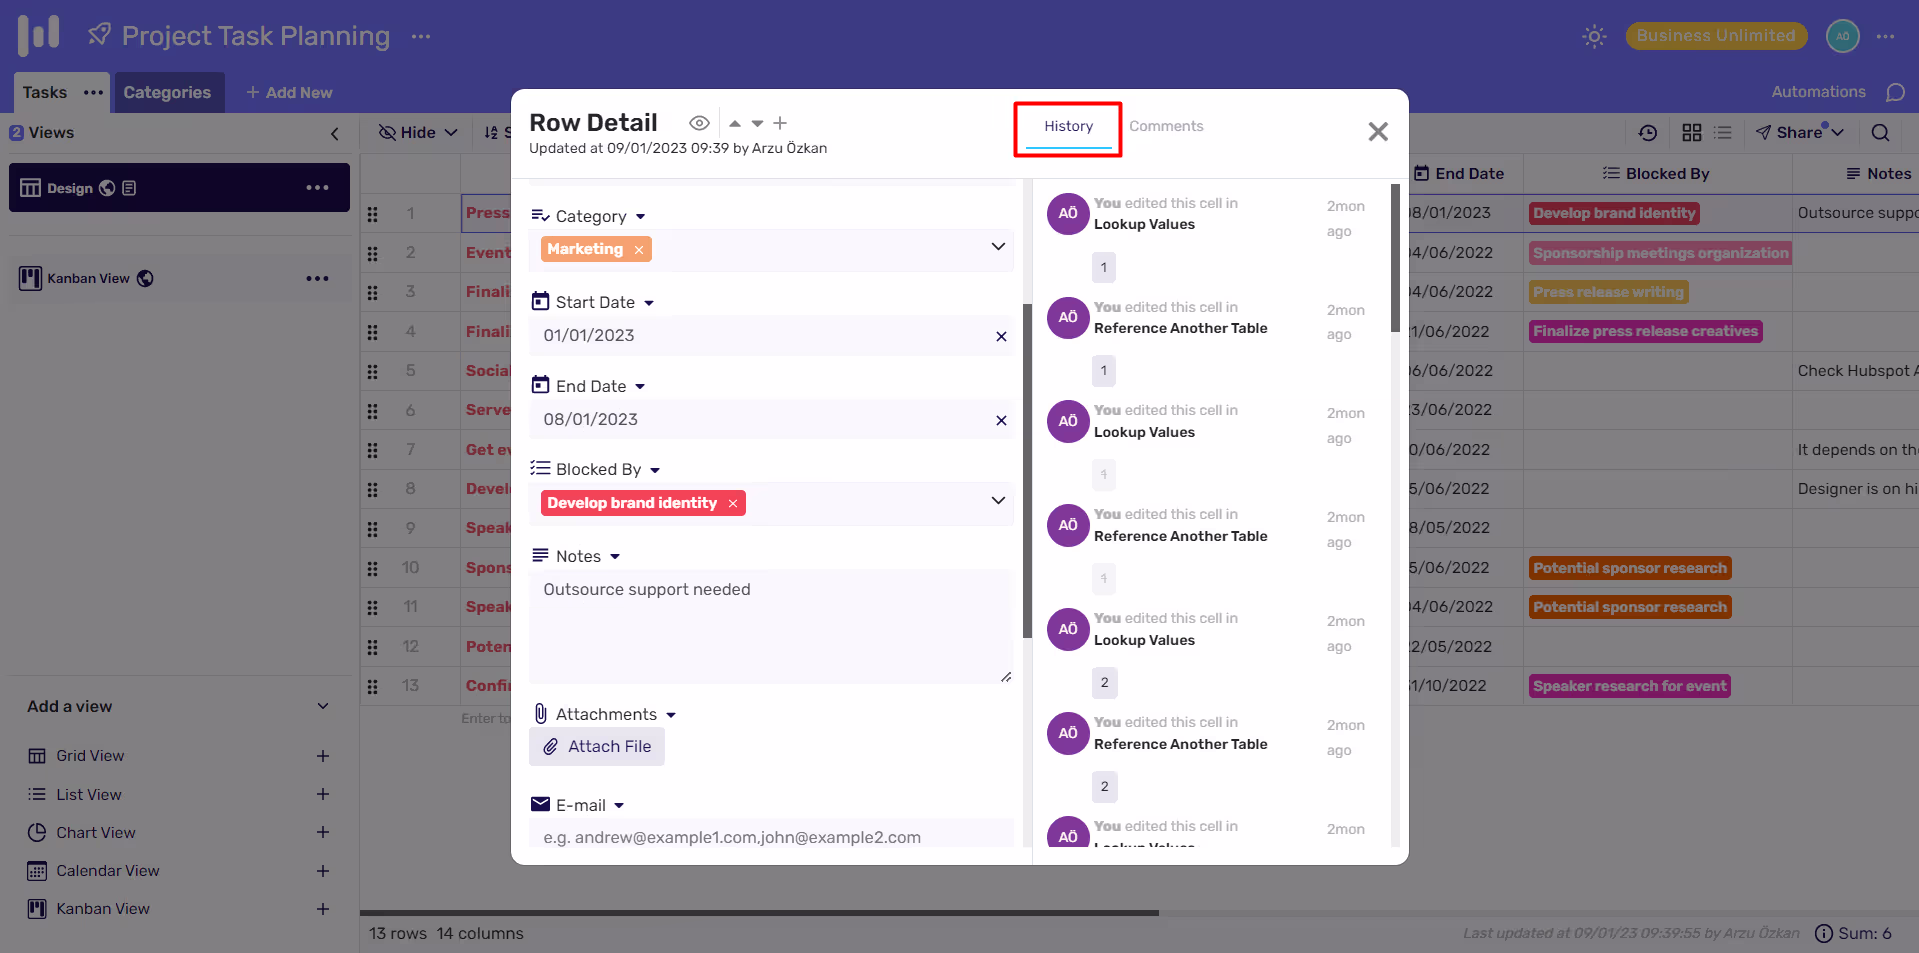
Track all history
Retable allows you to easily track all data history, which can be used to see changes made to the data over time. Here are the steps to track all data history with Retable:
- Log in to your Retable account
- Select the appropriate workspace from the list of workspaces
- Select the appropriate project from the list of projects
- Click on the expand icon at the beginning of any row to see all "Row Detail and History"
- Retable will show you a list of all the changes that have been made to the data in the specific row, including the date, time, and user who made the change.
By tracking all data history with Retable, you can easily see how the data has changed over time, and it can help you ensure data consistency and integrity. It also allows you to track who made the changes and when, which can be useful for auditing and troubleshooting purposes.
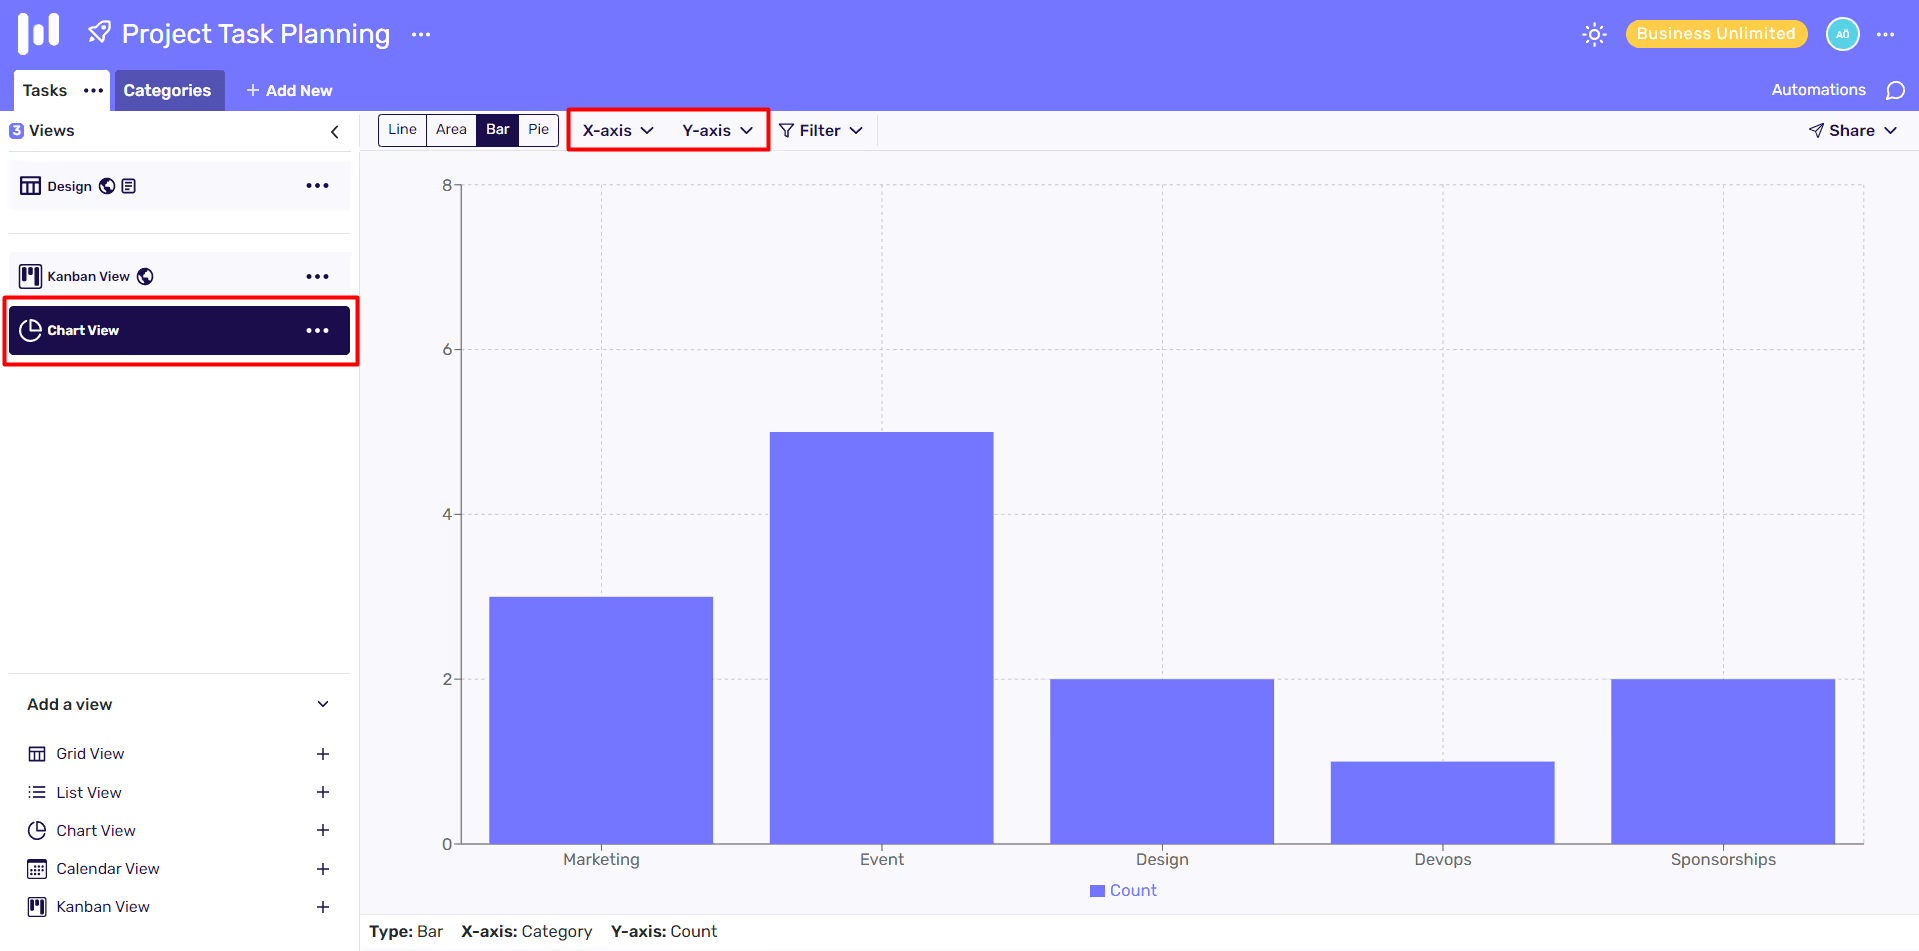
Creating quick reports
Retable allows you to easily create quick reports, which can be used to analyze and visualize your data in a variety of ways. Here are the steps to create quick reports with Retable:
- Log in to your Retable account
- Select the appropriate workspace from the list of workspaces
- Select the appropriate project from the list of projects
- Click on the "Chart View" on the Views menu
- Choose the type of report you want to create (e.g. Line, Area, Bar, Pie)
- Select the x and y axis to create your chart
- You can also apply filters, sorting, and grouping to the report
- Give a name to the report by clicking the 3 dots near the view name.
- Retable will automatically create the report, and it will be added to the list of views.
- You can now start browsing the data in the report, and it will be easier to analyze and visualize.
- You can also share the reports with your teammates, and they can also access the data in the report.
By creating quick reports with Retable, you can easily analyze and visualize your data, and it can help you make better decisions. It allows you to see the data from different perspectives, and it can help you identify patterns and trends in your data.
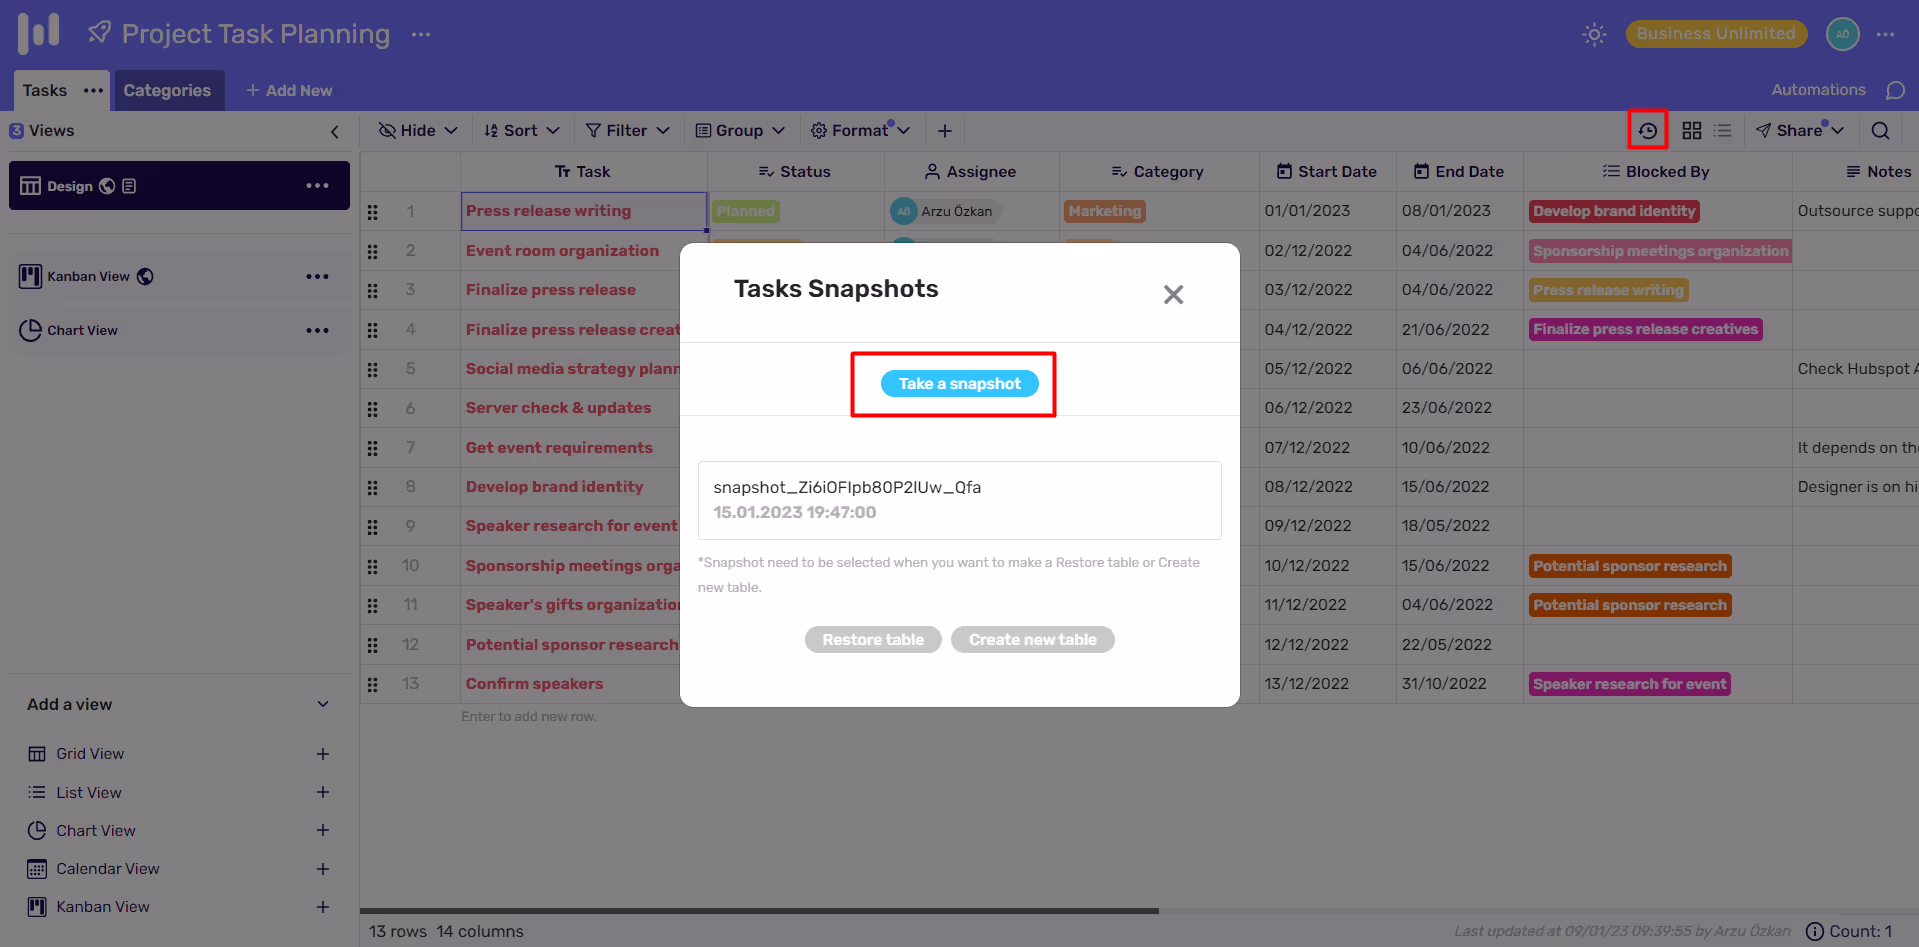
Backup Your Data
Retable automatically save your data on a regular basis to ensure that your data is safe and secure. Here are the steps to take advantage of Retable's data snapshot feature to take a backup of your data:
- Log in to your Retable account
- Select the appropriate workspace from the list of workspaces
- Select the appropriate project from the list of projects
- Click the "Table History" icon at the top right menu
- Select the "Snapshot" option
- Click "Take Snapshot" button
- Now, a copy of your table saved your Retable snapshot folder. You can revert to the previous version of your data anytime.
By using Retable's data backup feature, you can rest assured that your data is safe and secure. It allows you to easily revert to a previous version of your data if needed, and you can also download a backup of your data at any time. It gives you peace of mind knowing that your data is always protected.
Retable allows you to easily organize your data and create tables, which can help you make sense of your data and make it more accessible. Additionally, Retable offers advanced data management features, such as the ability to establish relationships between tables, set up indices, and create different data views. This can help you take full advantage of your data and make better decisions. Another benefit of using Retable is collaboration. Retable allows you to share your data with your teammates and control permissions, which can help you collaborate more effectively. Furthermore, Retable automatically backs up your data on a regular basis, so you can rest assured that your data is always safe and secure. Additionally, Retable allows you to easily create quick reports and visualizations, which can help you analyze and understand your data better. It is also user-friendly and cost-effective, making it accessible for small and medium-sized businesses. Overall, Retable is a powerful and versatile platform that can help you convert your spreadsheets to databases and make the most of your data. Start your free trial today!
more
Related Resources


Create your smart data management solution
Plan, track, and analyse with your ease. Transform your data with an all-in-one platform, collaborate with your teammates.
Try for free!