.avif)
.avif)
CSV stands for "Comma Separated Values." It is a file format used for storing data in a table structure, where each row represents a record and each column represents a field within that record. The values in the columns are separated by commas. CSV files are commonly used for data export and import, and can be opened and edited in a variety of software, including spreadsheets like Microsoft Excel and Retable.
Use Cases of CSV Files
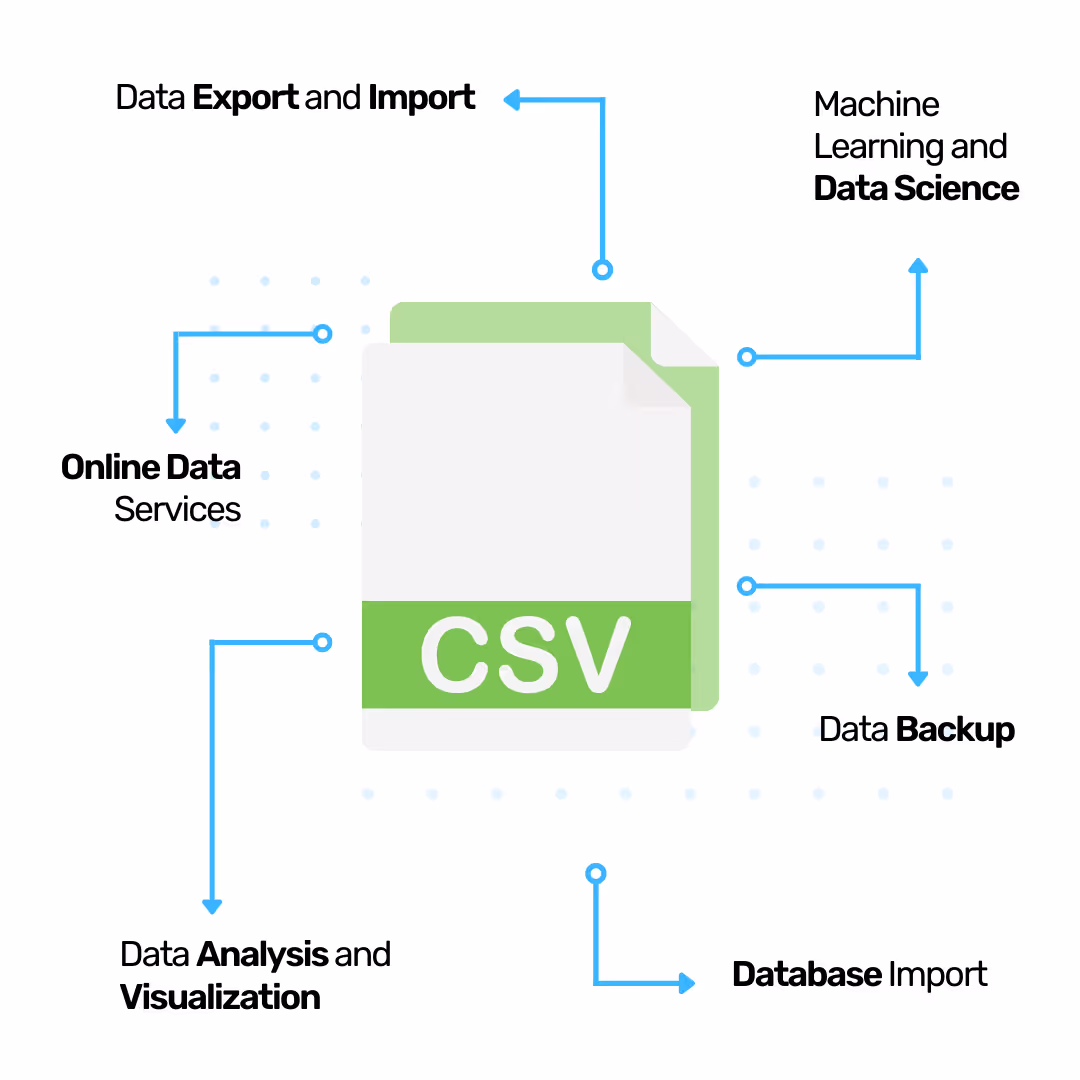
CSV files are commonly used for several use cases, including:
- Data Export and Import: CSV files are often used to export data from one application or system, and import it into another application or system. This allows for easy sharing of data between different platforms and tools.
- Data Backup: CSV files can be used to create backups of data, which can be useful for recovery in case of data loss.
- Data Analysis and Visualization: CSV files can be opened and edited in a variety of software, including spreadsheets like Microsoft Excel and Retable, which can be used for data analysis and visualization.
- Machine Learning and Data Science: CSV files can be used as a source of data for machine learning and data science projects, which can be loaded and manipulated in programming languages such as Python and R.
- Database Import: CSV files can be imported to databases like MySQL and SQL Server, to populate the database with data.
- Online Data Services: CSV files are used to import data to online services like Retable and Microsoft Excel Online, to allow collaboration and data visualization on the cloud.
Why CSV Files are Important?
.avif)
CSV files are important for several reasons:
- Interoperability: CSV files can be opened and edited in a wide range of software, including spreadsheet programs and text editors, which makes them a widely accepted and compatible format for data sharing and exchange.
- Simplicity: CSV files are simple in structure, with a plain-text format that is easy to understand and use. This makes it easy to import, export, and manipulate data.
- Accessibility: CSV files can be used to store large amounts of data and can be easily shared and distributed via the internet, making them accessible to a wide range of users and applications.
- Flexibility: CSV files can be used to store a wide range of data types, including numerical, textual, and date/time data.
- Machine Learning and Data Science: CSV files are commonly used to store data that is used for machine learning and data science projects. The data in CSV files can be loaded and manipulated using programming languages such as Python and R.
- Cost-Effective: CSV files are plain text files, which means they don't require proprietary software to open or edit them, making it easy and cost-effective to share, manipulate and store data.
Biggest Challenge in Viewing CSVs
.avif)
One of the biggest challenges in viewing CSV files is dealing with large and complex data sets.
- Data Visualization: CSV files often lack proper data visualization, which can make it difficult to understand and interpret the data. This can be particularly challenging when dealing with large data sets that contain many columns and rows.
- Data Size Limitation: Many software and tools have limitations on the size of data that can be imported from a CSV file, making it difficult to import and view large data sets.
- Handling Large Number of Columns: CSV files can contain a large number of columns, which can make it difficult to view the data in a single screen, and can make it hard to compare and analyze the data.
- Missing or Incomplete Data: CSV files often contain missing, duplicate, or irrelevant data, which can make it difficult to understand and interpret the data.
- Handling of Date and Time Data: CSV files do not have any inbuilt functionality to handle date and time data, which can make it difficult to view and analyze the data.
- Handling of Different Data Types: CSV files can contain different types of data, such as numerical, textual, and date/time data, which can make it difficult to view and analyze the data in a meaningful way.
How to Solve CSV Viewing Problems?
There are several ways to solve the challenges that come with viewing and working with CSV files:
- Data Validation: Use data validation tools or scripts to check for errors and inconsistencies in the data, and to ensure that the data meets certain constraints or requirements.
- Data Cleaning: Use data cleaning tools or scripts to remove missing, duplicate, or irrelevant data, and to format and prepare the data for analysis or processing.
- Data Encoding: Use encoding detection tools or scripts to automatically detect the character encoding used in the CSV file, or specify the encoding when importing the data into a tool or application.
- Data Visualization: Use data visualization tools or scripts to create charts, graphs, and other visual representations of the data, which can make it easier to understand and interpret the data.
- Data Processing and Manipulation: Use programming languages such as Python, R, or SQL to process and manipulate large data sets, and to aggregate, filter, and transform the data.
- Data Security: Use encryption and password protection to secure sensitive data in the CSV files. Use Secure File Transfer Protocol (SFTP) or Secure Copy Protocol (SCP) to transfer the files securely.
- Handling Large Number of Columns: Consider using tools that can handle a large number of columns, such as a spreadsheet software or a database management system.
- Handling of Date and Time Data: Use programming languages or tools that have inbuilt functionality to handle date and time data, such as Python, R, or SQL.
- Handling of Different Data Types: Use programming languages or tools that have inbuilt functionality to handle different data types, such as Python, R, or SQL.
- Use Smart Online Data Visualization Tools: There are several smart online database visualization tools that can help solve the challenges of viewing and working with CSV files. Retable is a data visualization tool that can connect to a wide variety of data sources, including CSV files, and allows users to create interactive dashboards and reports. Retable typically offers features such as data filtering, sorting, and formatting, which can make it easier to understand and interpret large and complex data sets. Retable also offer a wide variety of visualizations, such as bar charts, line charts, and pie charts, which can make it easier to see patterns and trends in the data. Additionally, Retable tool typically offers collaboration features, such as the ability to share dashboards and reports with others, which can make it easier to work on data projects as a team.
Let's see how to solve CSV Viewing problems with Retable, the smart online data visualization tool.
.avif)
- Import your CSV files to Retable
- Customize your columns
- Use data validation, duplicate data control and data formatting features
- Add conditional formatting rules
- Create different data views
- Create dynamic charts
- Share your data to collaborate
Import Your CSV Files to Retable
There are several ways to import CSV files into Retable, a web-based data management and visualization tool. We'll describe the easiest way for beginners.
- Create a workspace: Login to your Retable account and click the "+Add Workspace" button to create your first workspace. Then, give a name to your workspace.
- Select your CSV to Import: Scroll the page and import your CSV by selecting the Import document option from the workspace creation screen. Then select a CSV to import from your device. And click the "Upload" button.
- Click the Build Now Button: Click the "Build Now" button to create your first workspace with your imported CSV file.
Once the data is imported, you can use Retable's features to clean, transform, and visualize the data. Retable's drag-and-drop interface allows you to quickly format and filter your data, create custom calculations, and build charts and reports.
Now, your CSV file is ready to work on it. After finishing these 3 steps, you'll be redirected to your Retable dashboard. You can easily see your imported CSV on your Retable dashboard. By clicking the related project that you imported your CSV you can easily see your CSV data in a grid spreadsheet format.
Now let's see how to customize your CSV data with Retable's smart & customizable data visualization features.
Customize Your Columns
.gif)
Retable offers several ways to customize columns in a CSV file once it has been imported into the platform:
- Renaming Columns: You can rename columns by right-clicking on the column header and selecting customize column.
- Reordering Columns: You can reorder columns by clicking and dragging the column headers to the desired location.
- Hiding Columns: You can hide columns by clicking on the "Hide" icon in the toolbar and selecting the column you want to hide.
- Adding Columns: You can add new columns by clicking on the "+" button in the column header section and selecting the type of column you want to add.
- Removing Columns: You can remove columns by right-clicking on the column header and selecting the "Delete selected column" option.
- Data Type Conversion: You can convert data types of columns by right-clicking the column header, choosing the "Customize Column" option and selecting a column type you want to convert to.
- Grouping Data: You can group data by clicking on the "Group" icon in the toolbar and then selecting a column that you want to group by. This allows you to aggregate data by the values in that column.
- Formatting Columns: You can format your columns by clicking the "Format" icon in the toolbar and then selecting "Colum Style". There're several column formatting options like bold, italic, underlined, background color or text color. You can apply any of these formats to your columns.
- Conditional Formatting: You can apply conditional formatting to your data by clicking the "Format" icon in the toolbar and then selecting "Conditional Formatting". Conditional formatting helps you to create dynamic data styling rules. There're several conditional formatting options like bold, italic, underlined, background color or text color. Conditional formatting work according to the rules that you create.
These features can be used to customize columns in the CSV file, making it easier to work with and understand the data.
.gif)
Use Data Validation, Duplicate Data Control and Data Formatting Features
Retable offers several features for data validation, duplicate data control and data formatting that can help ensure the quality of your data:
- Data Validation: Retable has built-in data validation rules that can be applied to specific columns or to the entire table. These rules can check for things like required fields, data type, and format consistency. You can also create custom validation rules using the formula editor.
- Duplicate Data Control: Retable allows you to identify and remove duplicate rows from your data. You can activate the "Unique" checkbox from your "Customize Column" area. So, Retable automatically detects your duplicate data and then highlights the duplicate data for you to review and remove as needed.
- Data Formatting: Retable allows you to format data in a variety of ways to make it more readable and understandable. You can format numbers, dates and time, and strings in a variety of ways from the "Customize Column" area.
These features help to improve the quality of your data, making it easier to work with and understand. With Retable's data validation and duplicate data control, you can ensure the data is accurate and consistent. And with the data formatting feature, you can make your data readable, understandable and ready for analysis.
Add Conditional Formatting Rules
.gif)
Retable allows you to add conditional formatting rules to your data in order to highlight certain cells or rows based on certain conditions. Here's how you can add conditional formatting rules in Retable:
- Click the "Format" icon from the toolbar.
- Select the "Conditional Formatting" option.
- In the "Conditional Formatting" field, click "+Add Format"
- First, select the column you want to apply conditional formatting
- Then, select the condition that will trigger the formatting.
- Select the formatting style you want to apply when the condition is met.
- You can choose from a variety of options such as color, font style, and more.
- Click on "Apply" to save the formatting rule.
- You can add multiple conditions by clicking the "Add format" button.
- You can also remove or edit the formatting rule from the same panel.
By using conditional formatting, you can quickly identify patterns, outliers or other interesting information in your data. This can help you to make better decisions, identify issues and trends, and improve your overall understanding of the data.
Create Different Data Views
.gif)
Retable offers several data view options so you can view your CSV data in different views. These are list view, kanban view, calendar view, grid view and chart view. As soon as you import your CSV files to Retable, your data are automatically shown in a grid view. Thanks to Retable's different data views, you can view your data in various views by quickly switching between other data views without ever breaking your main data. help you better understand and analyze your data.
Here's how you can create different data views in Retable:
- Click on the "Views" button on the top left corner of the screen.
- Select "Add a view" option.
- Give a name to your new view by clicking the 3 dots near your view name.
- You can also filter your view's data by adding a filter criteria, this will only show the data that matches the criteria you set.
- You can also sort the data by clicking on the sort button, you can sort data by ascending or descending order.
- You can switch between different views by clicking on the "Views" button and selecting the view you want to see.
- You can also delete the view by clicking on the 3 dots near your view name and click the "Delete view" button.
- To create a Kanban view, you should have a "Collaborator" or "Select" column type.
- To create a Calendar view, you should have a "Calendar" colun type.
Creating different data views in Retable can help you focus on specific aspects of your data and make it easier to identify patterns, trends, or outliers. You can create different views for different purposes, such as one view for data analysis, and another view for data visualization. This can help you to better understand your data and make more informed decisions.
Create Dynamic Charts
.gif)
Retable allows you to create dynamic charts to visualize and analyze your data. Here's how you can create dynamic charts in Retable:
- Click on the "Views" button on the top left corner of the screen.
- Select "Add a view" option.
- Select "Chart View"
- Select the type of chart you want to create, such as a bar chart, line chart, pie chart, etc.
- In the chart configuration options, you can specify the X and Y axis, choose the data series, and customize the appearance of the chart.
- You can also filter the data in the chart by clicking on the "Filter" button, this will only show the data that matches the criteria you set.
- You can also change the chart type
Creating dynamic charts in Retable can help you to quickly identify patterns and trends in your data and make more informed decisions. The ability to filter, add and remove data series, and change the chart type allows you to explore and analyze your data in a flexible and dynamic way.
Share Your Data to Collaborate
.gif)
Retable allows you to easily share your data with others and collaborate on it in real-time. Here's how you can share your data and collaborate with Retable:
- Click on the 3 dots near your project name and select "Invite Collaborators" button.
- Enter the email addresses of the people you want to share the data with.
- You can also set permissions for each person, such as "Viewer", "Editor" or "Owner"
- Click on "Invite" to send the invitation to the people you've added.
- Once the people you've invited have accepted the invitation, they'll be able to access and collaborate on the data in real-time.
- You can also add comments by clicking on the "Row Detail" button, this is useful when you want to ask questions or make suggestions.
- You can also see the changes that others have made by clicking on the "History" button.
Sharing your data and collaborating with Retable can help you to work more efficiently and make better decisions. You can share data with your team, clients or partners, and work together to analyze and understand the data in real-time. This can help you to make better decisions, identify issues and trends, and improve your overall understanding of the data.
In conclusion, Retable is a powerful tool that can help you to manage CSV files more effectively. It has a user-friendly interface that makes it easy to import and view your CSV files, allowing you to quickly and easily organize, filter, and analyze your data. Retable provides a variety of data visualization options, such as dynamic charts, kanban boards, and different data views, which can help you to better understand and analyze your data.
Additionally, Retable has built-in tools for data validation, duplicate data control, and data formatting that can help you to ensure your data is accurate and consistent. Additionally, Retable allows you to customize the columns in your CSV file so that you can better organize and understand your data. You can also add conditional formatting rules to highlight important data, so you can quickly identify patterns and trends in your data. With the ability to share your data with others and collaborate on it in real-time, Retable can help you to work more efficiently and make better decisions. And, Retable provides a secure platform for storing and sharing your data, so you can be confident that your data is protected. All these features of Retable make it a powerful tool to help you to more effectively organize, understand, and analyze your data.
🎯 Don't wait any longer, sign up for Retable today and start managing your CSV files more effectively!
more
Related Resources


Create your smart data management solution
Plan, track, and analyse with your ease. Transform your data with an all-in-one platform, collaborate with your teammates.
Try for free!